Project Overview
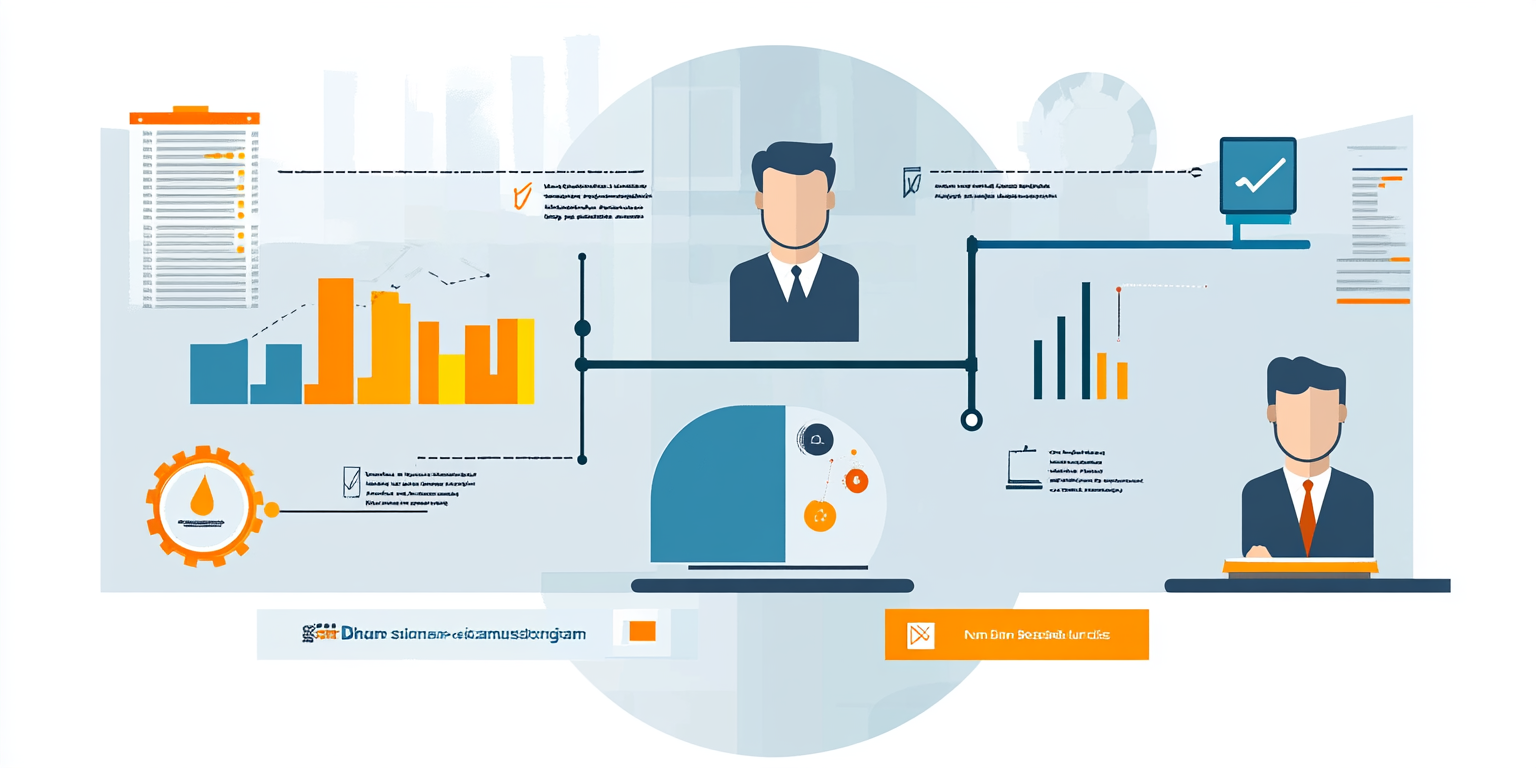
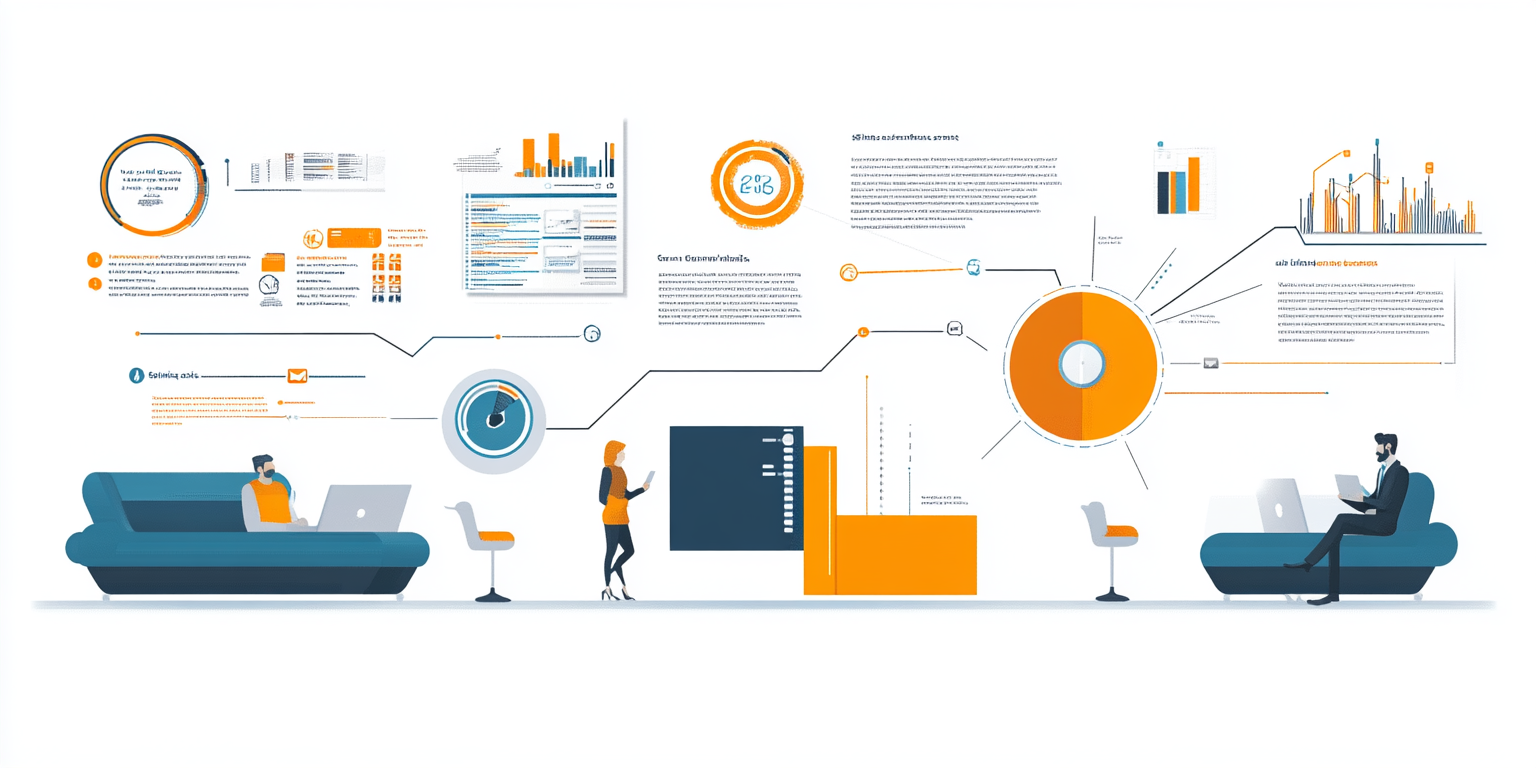
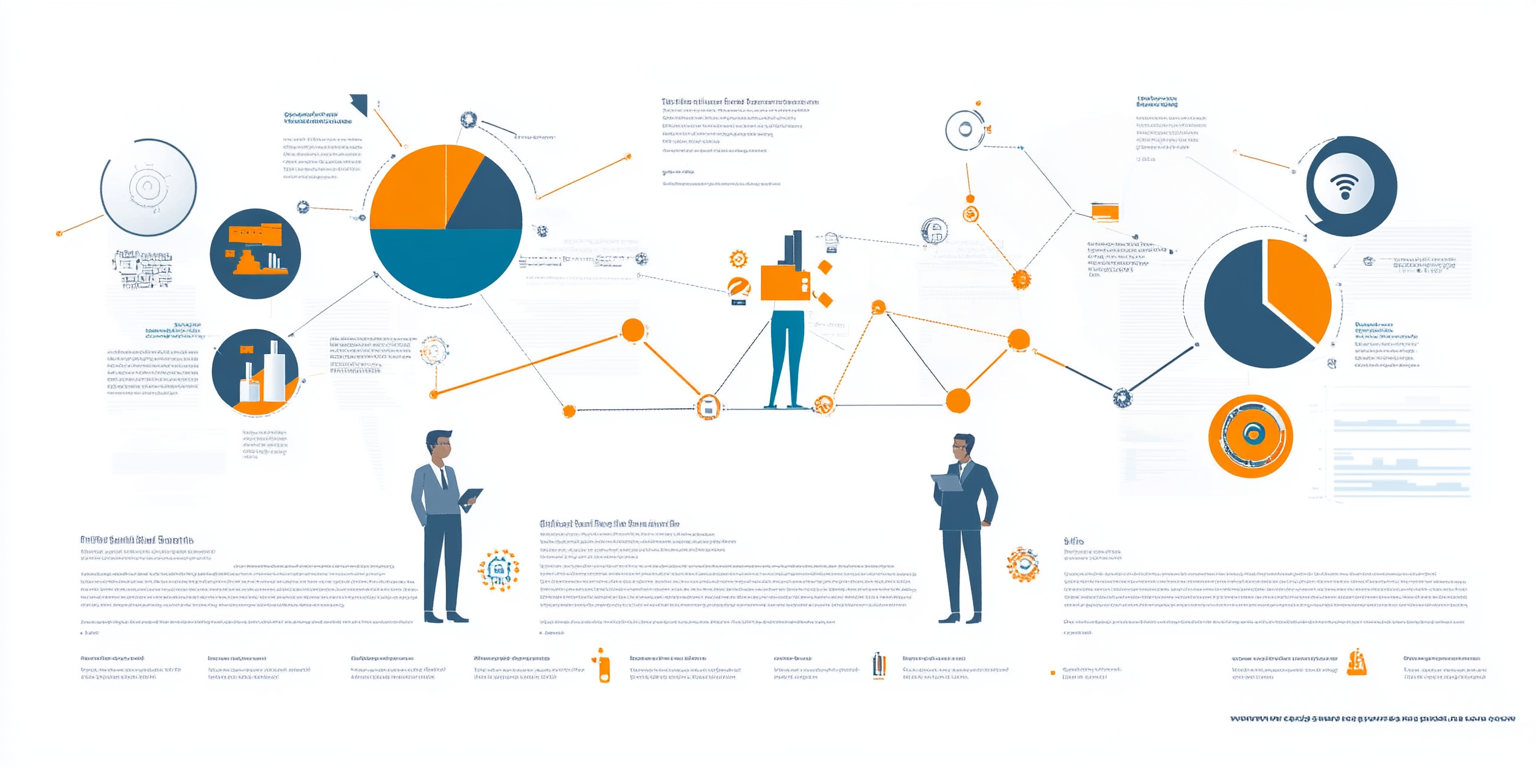
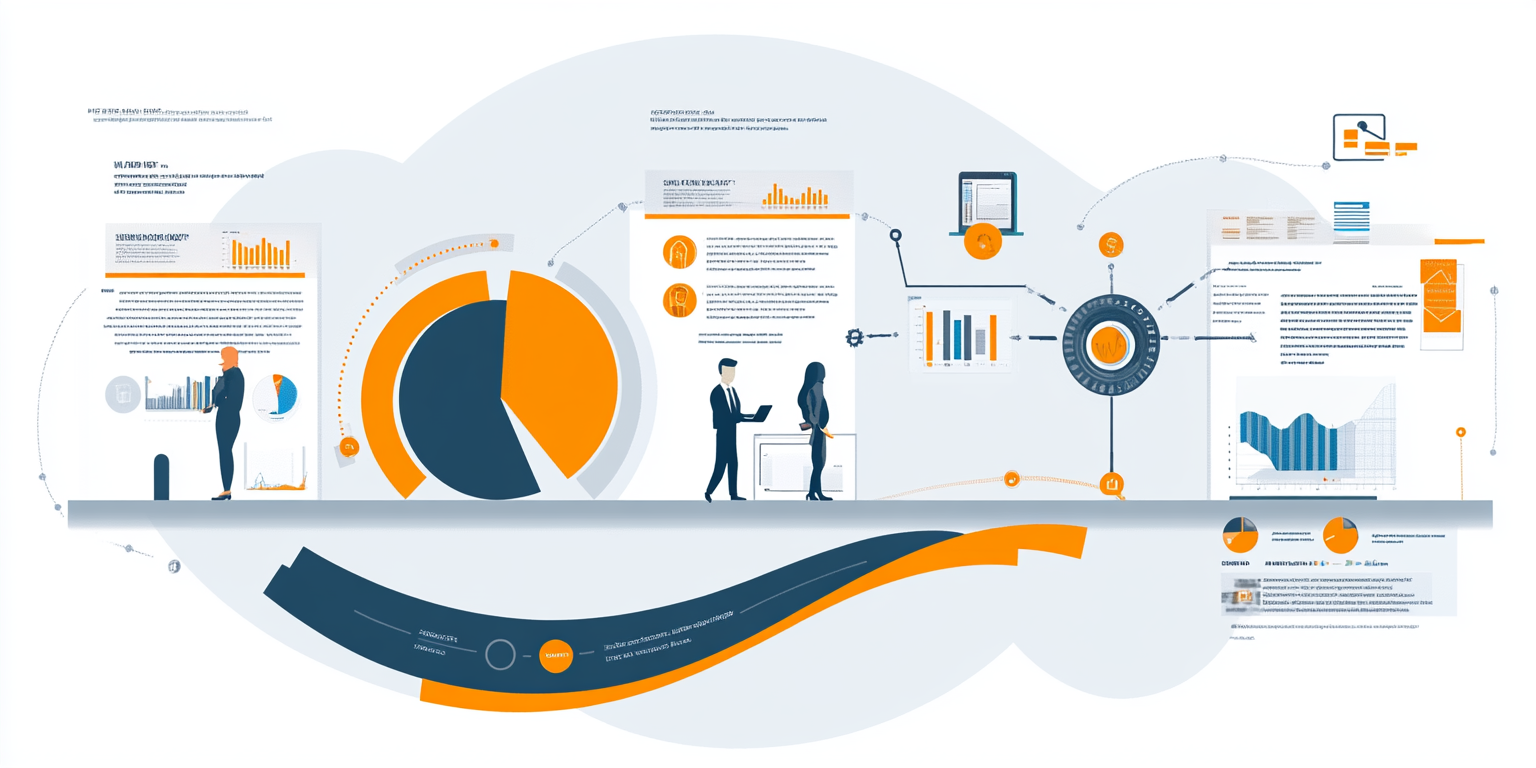
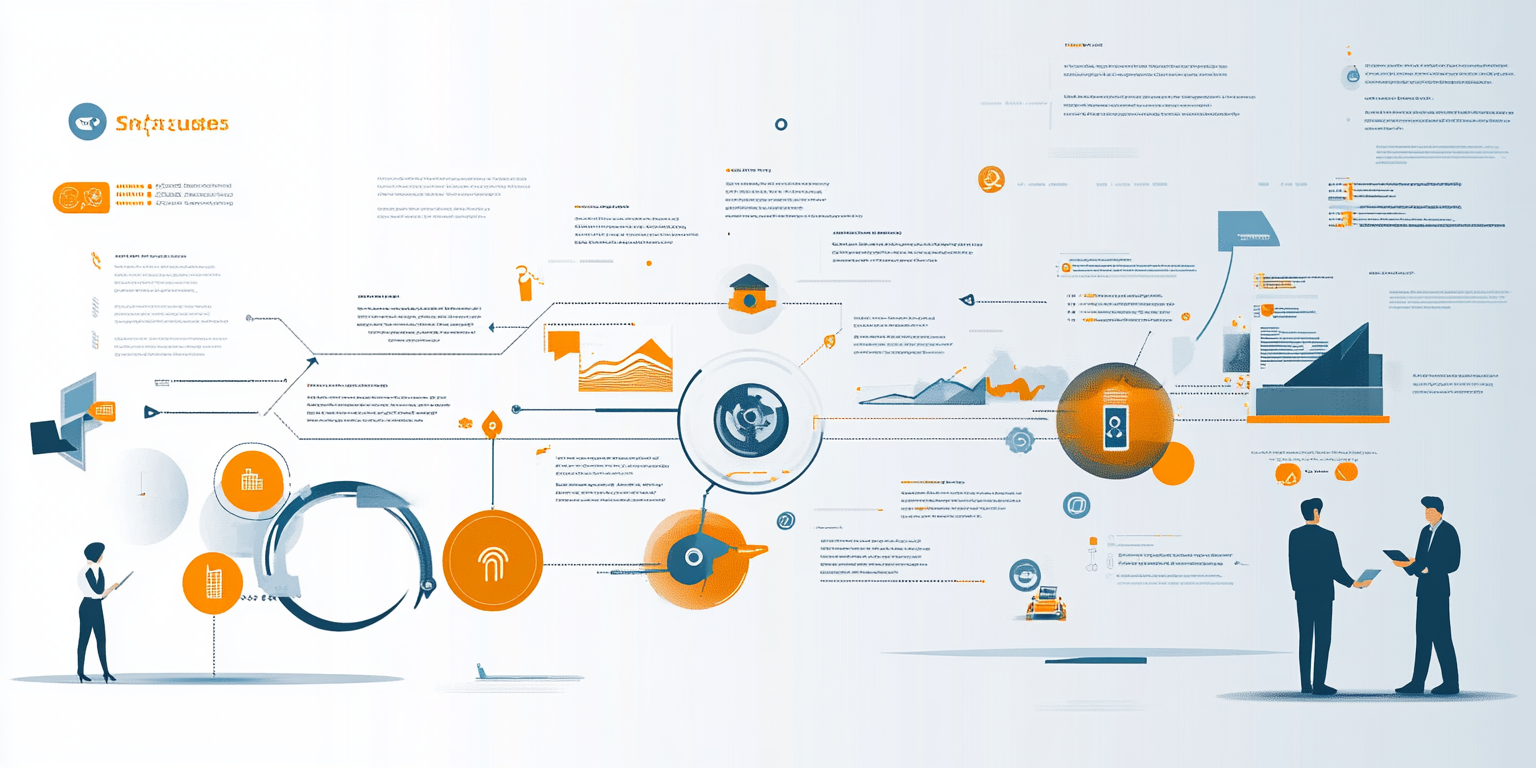
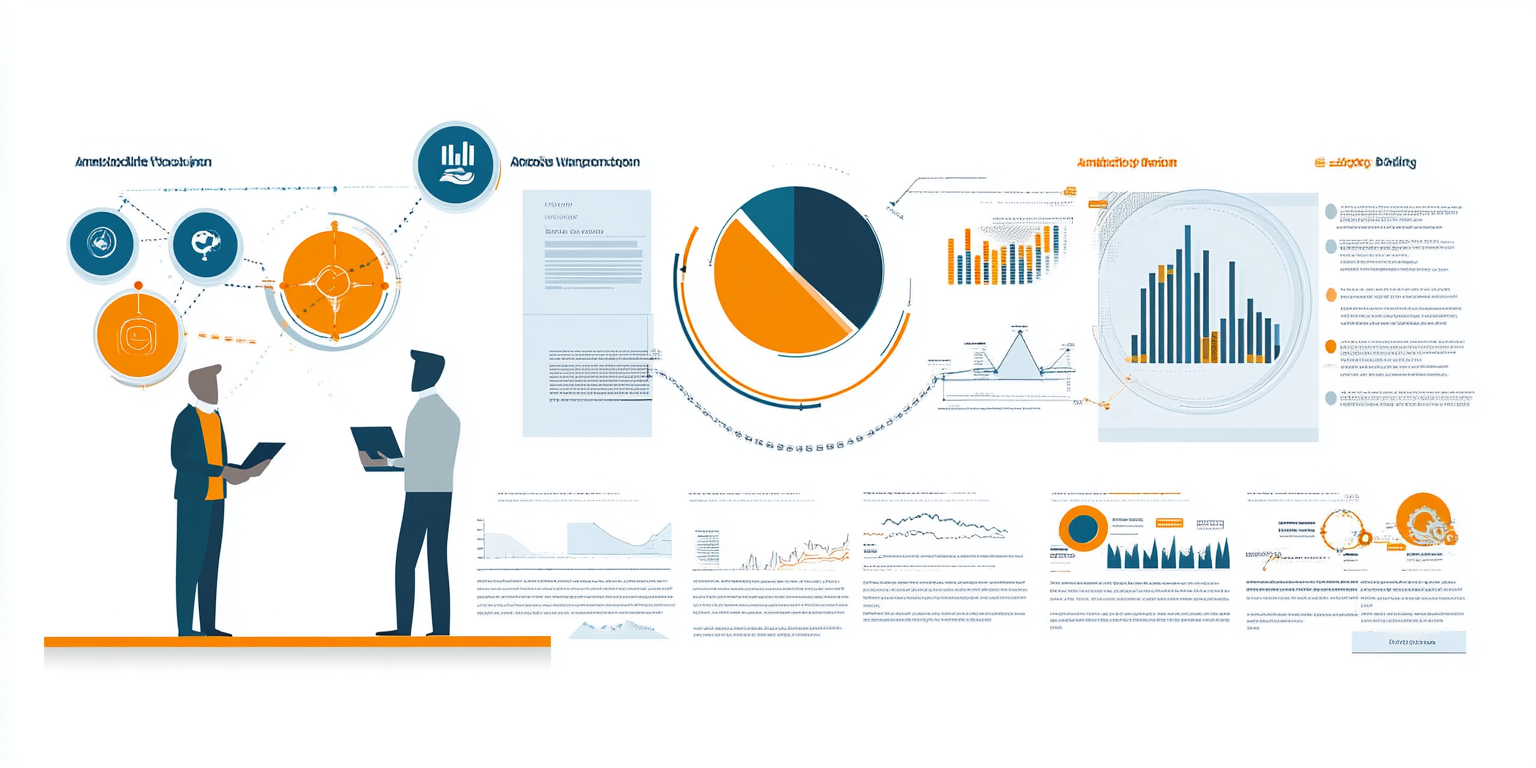
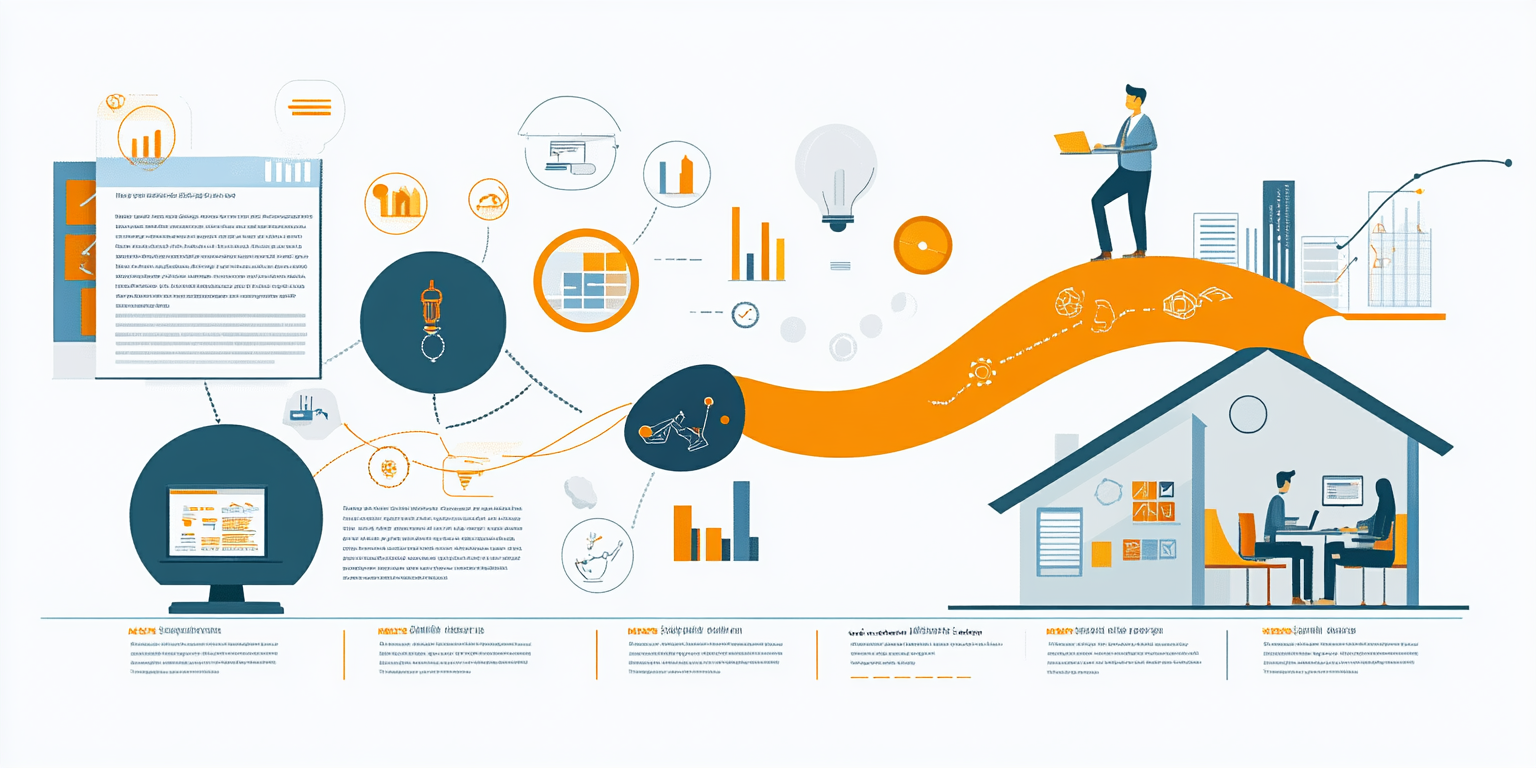
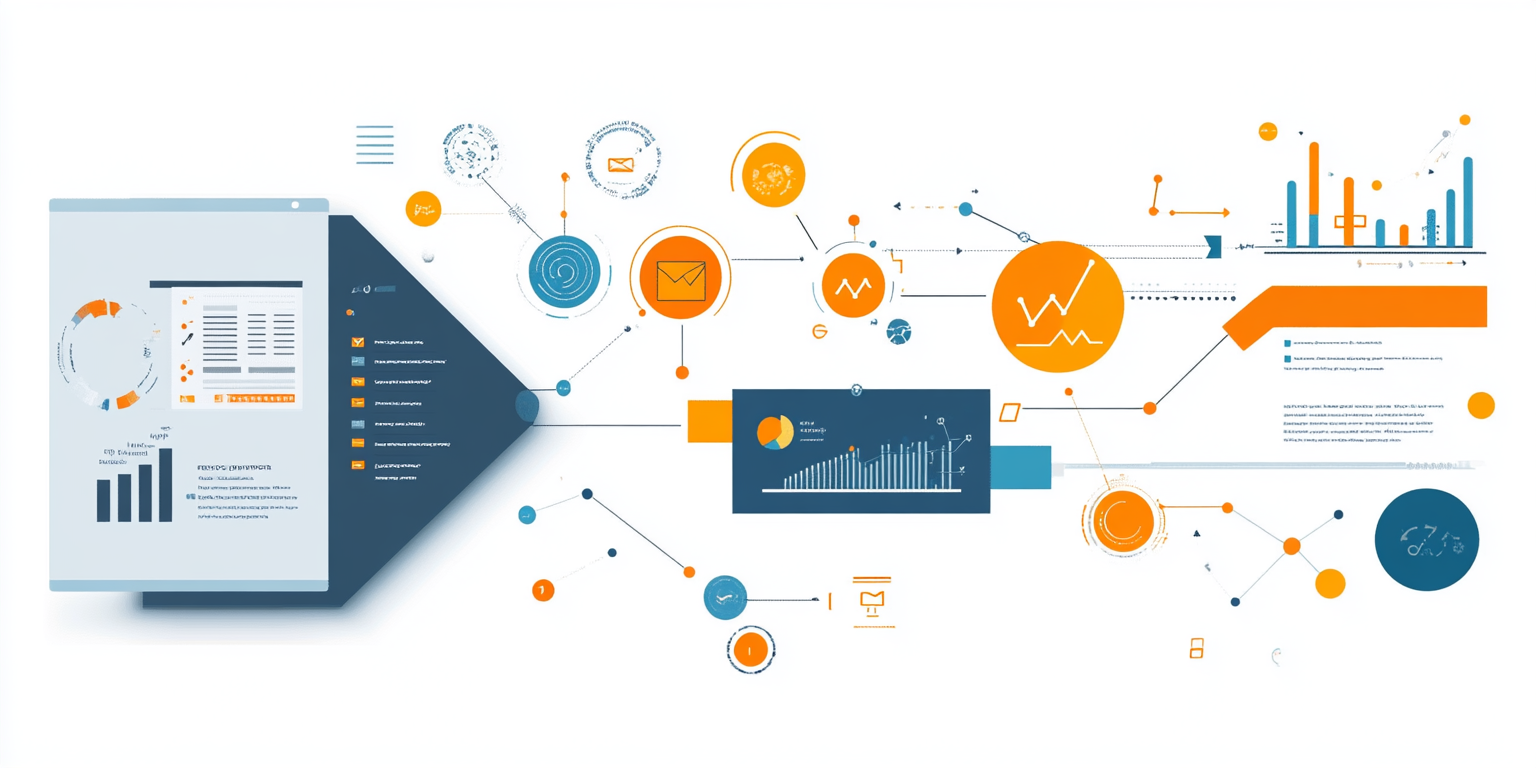
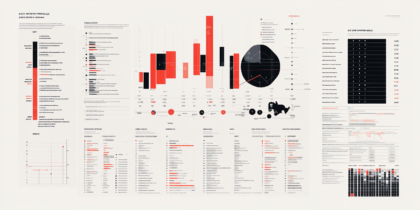
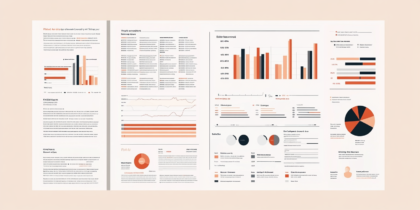
The Digital Innovation and Data-Driven Branding Collection represents the seamless fusion of technology, analytics, and modern branding. Designed for tech-focused enterprises, startups, and data-driven businesses, this visual identity emphasizes clarity, efficiency, and innovation through structured layouts and dynamic graphical elements.
- Year of Completion: 2025
- Status: Active
Design Concept
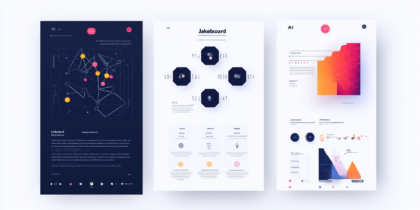
This branding system leverages a futuristic aesthetic, integrating sleek typography, structured data visualization, and a sophisticated color palette of deep blues and warm oranges. The composition embodies precision and connectivity, making it ideal for fintech, SaaS platforms, and AI-driven companies.
Key Features:
- Tech-Inspired Aesthetic: A blend of minimalism and complexity with structured grid systems.
- Versatile Branding Application: Used across digital dashboards, marketing collateral, and corporate identity materials.
- Data-Driven Design: Incorporates infographics, flowcharts, and smart visual elements for storytelling.
- Typography & Color Palette: A refined mix of deep navy, vibrant orange, and neutral greys, creating a balanced and professional look.
- High-Quality Digital Execution: Responsive design for both print and web applications.
Deliverables
- Full brand identity package
- Digital marketing templates for reports and presentations
- Data visualization assets for analytics-driven branding
- UX/UI components for seamless user experiences
- Interactive website and social media branding
Tools Used
- Adobe Illustrator (Infographic and Branding Elements)
- Adobe XD & Figma (UX/UI Design & Prototyping)
- Tableau & Power BI (Data Visualization)
Impact & Market Appeal
- Strategic Branding for Tech Enterprises: Enhances credibility and digital presence.
- Optimized for Data-Driven Engagement: Supports clear communication through visual storytelling.
- Future-Proof Aesthetic: Balances modern sophistication with functional minimalism.
Challenges & Solutions
Challenges Encountered
- Ensuring the balance between a visually appealing design and highly functional data representation.
- Crafting a universal yet unique identity adaptable across digital platforms.
Solutions Implemented
- Developed a modular design system, allowing for scalability in both digital and print media.
- Integrated an intuitive layout structure to enhance user experience and readability.

