Project Overview
The Data-Driven Insights Collection is a refined visual identity crafted for businesses, research institutions, and analysts who rely on complex data interpretation. This branding concept embraces a structured and minimalistic aesthetic, focusing on clarity and impact. With a monochrome and red accent color scheme, the visuals emphasize precision, accuracy, and an analytical mindset.
- Year of Completion: 2025
- Status: Active
Design Concept
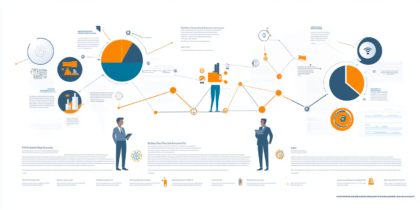
This collection transforms raw data into compelling visual storytelling. The use of clean typography, structured layouts, and high-contrast color schemes ensures readability while enhancing the perception of professionalism and trust.
Key Features:
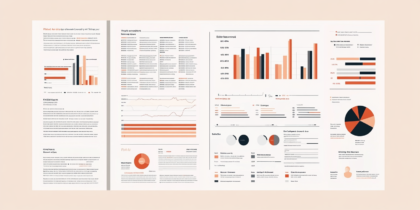
- Minimalist Data Visuals: Pie charts, bar graphs, and heatmaps in a sleek, monochrome palette with red highlights for emphasis.
- Clear Information Hierarchy: Thoughtfully arranged text and graphics that make complex insights easy to digest.
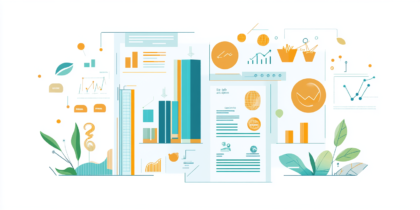
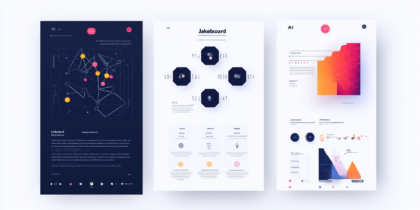
- Versatile Application: Designed for research reports, financial presentations, analytics dashboards, and data-driven publications.
- Typography & Color Palette: A sophisticated blend of black, white, and red ensures a striking yet functional visual identity.
- High-Resolution Printing: Crisp, professional layouts that maintain their integrity in both digital and print formats.
Deliverables
- Comprehensive infographic designs
- Corporate data reports and dashboards
- Financial and market analysis reports
- Presentation templates for data-driven businesses
- Interactive visuals for digital applications
Tools Used
- Adobe Illustrator (Vector Graphics & Infographics)
- Adobe Photoshop (Data Visualization & Layouts)
- Tableau & Excel (Data Interpretation & Graphs)
Impact & Market Appeal
- Professional Data Storytelling: Elevates brands and institutions by turning complex information into impactful visuals.
- Trusted & Analytical Aesthetic: Appeals to finance, research, and business sectors with a clean, precise design language.
- Universal Usability: Works across different industries, from corporate finance to academic research.
Challenges & Solutions
Challenges Encountered
- Ensuring readability while keeping the design sleek and minimalistic.
- Creating a balance between visual appeal and functionality for real-world use cases.
Solutions Implemented
- Used high-contrast color schemes and structured grids for better clarity.
- Designed data elements with hierarchy and spacing that improve interpretation speed.