Project Overview
The Minimalist Data Report Collection represents a refined approach to information design, merging clarity with aesthetic sophistication. Designed for analysts, business leaders, and corporate strategists, this visual system enhances data presentation through a structured, soft-toned layout that ensures effortless readability.
- Year of Completion: 2024
- Status: Active
Design Concept
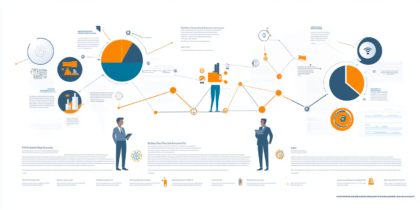
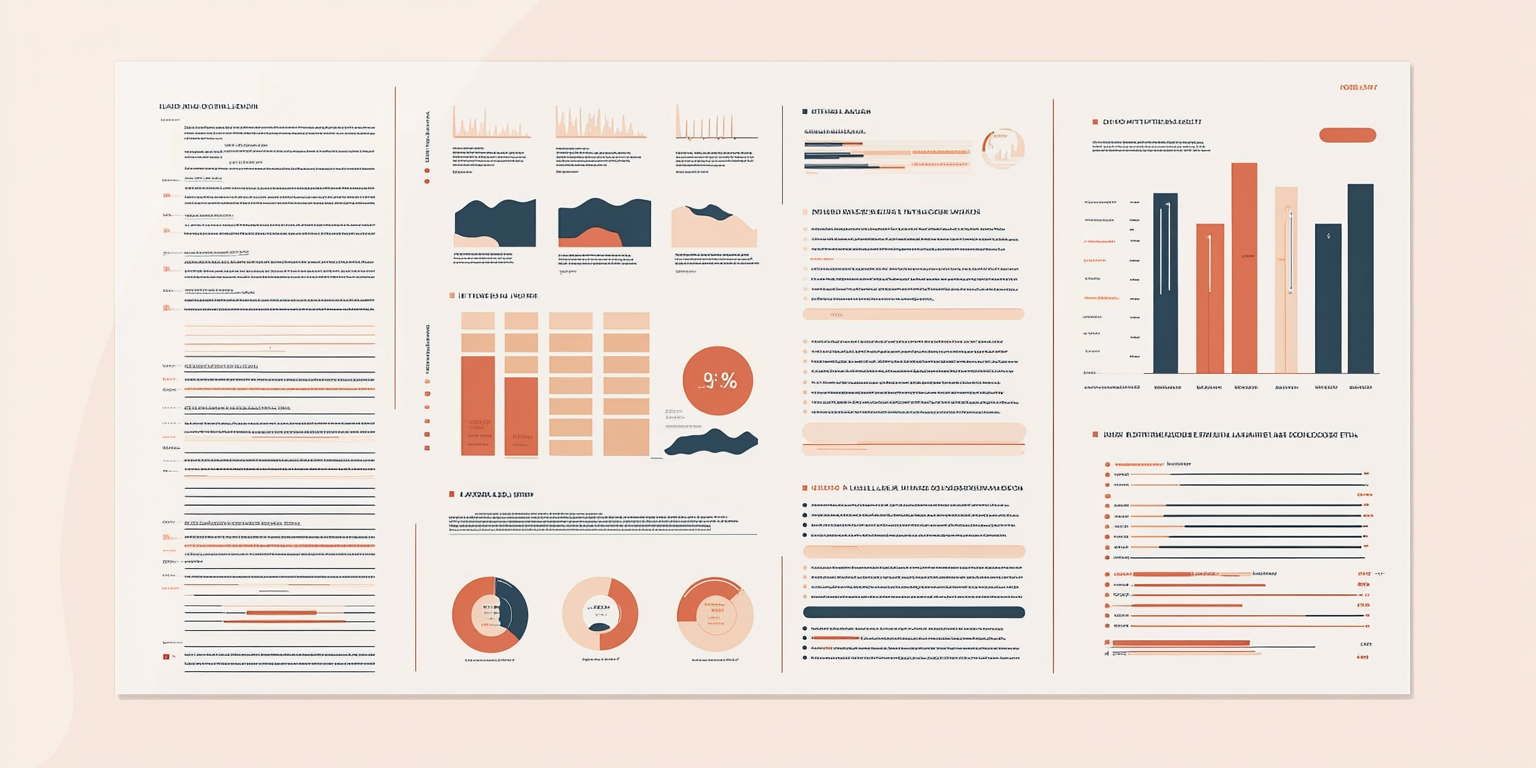
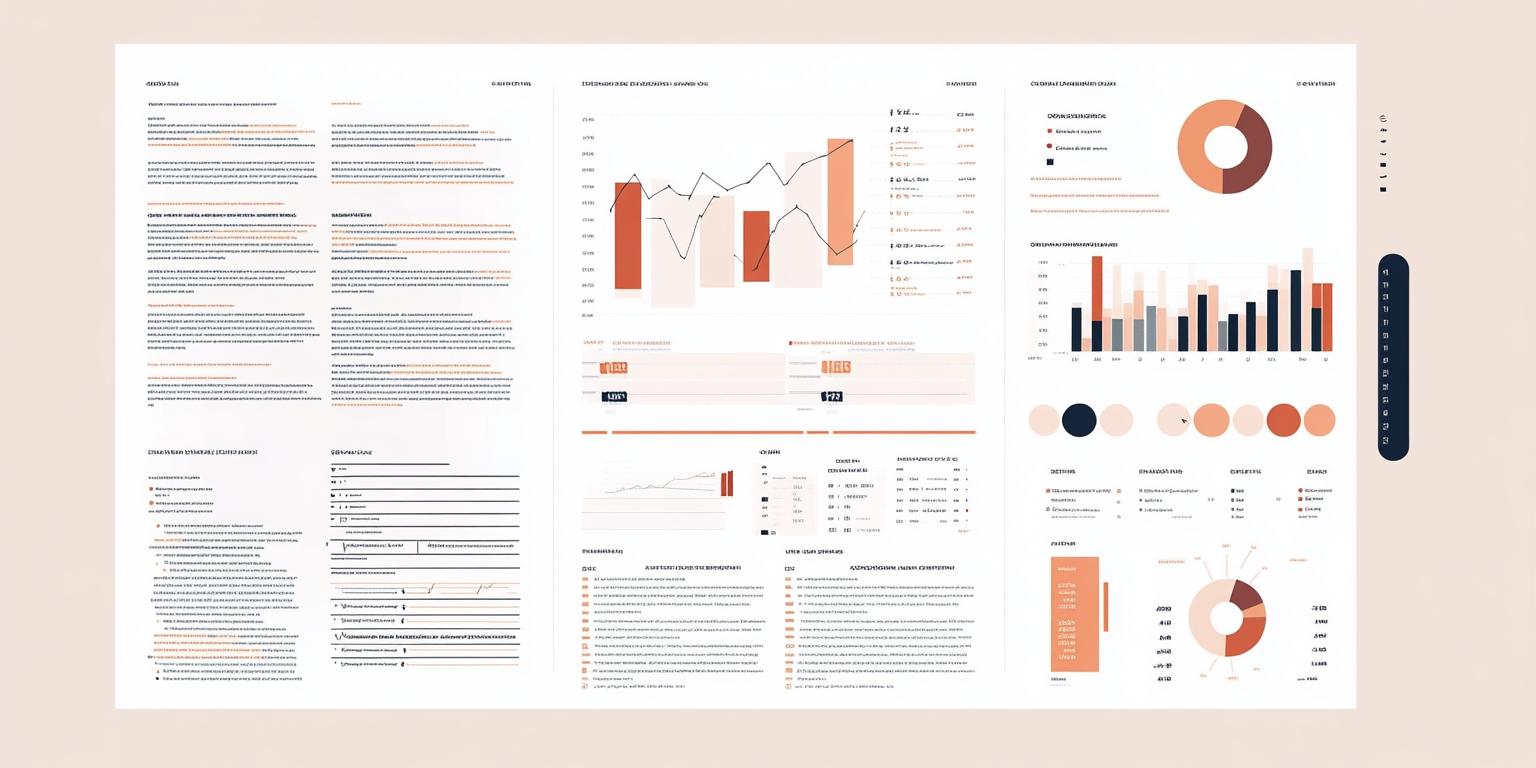
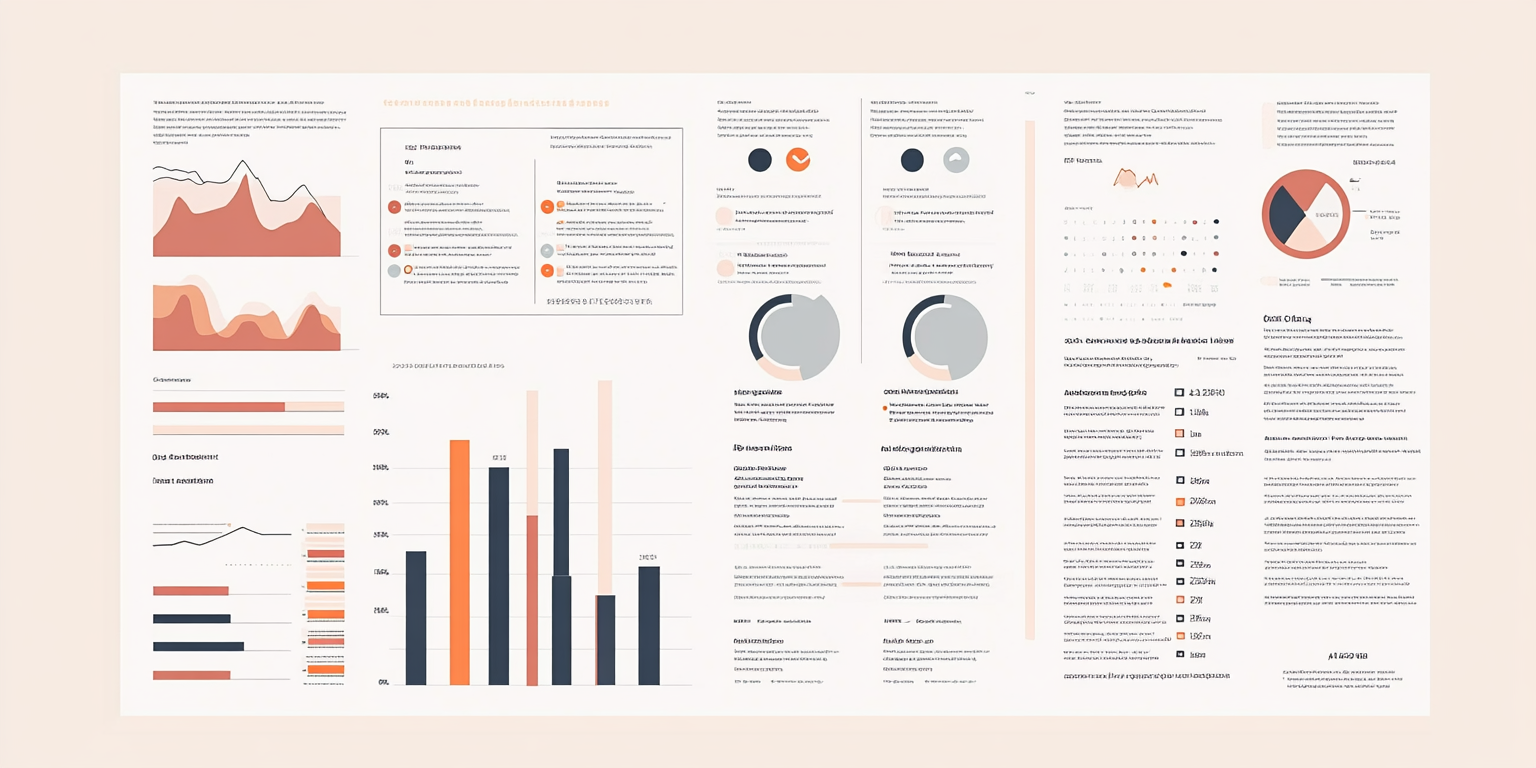
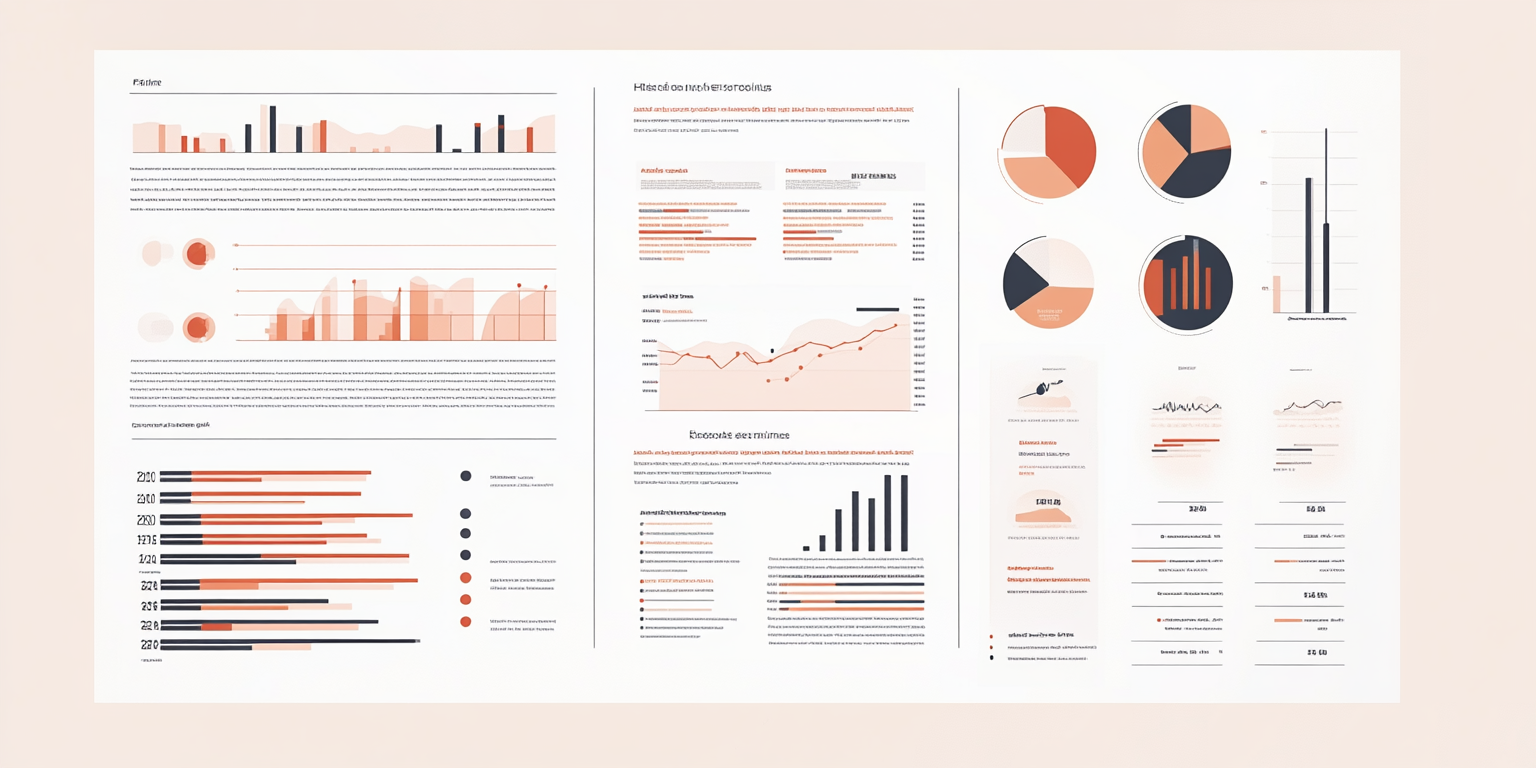
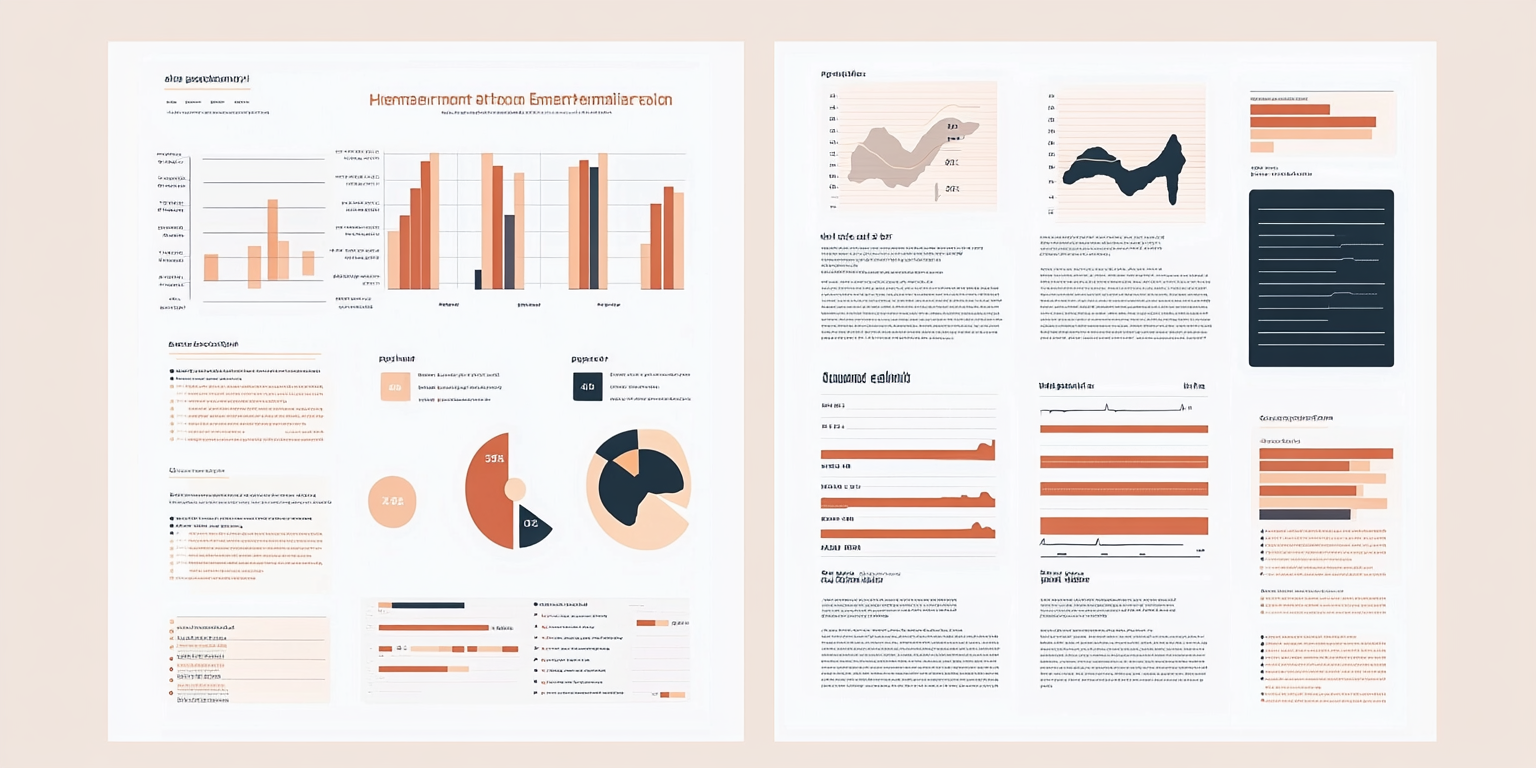
This report collection adopts a clean and professional style, using a neutral color palette of warm beige, coral, and navy to create a sophisticated and calming data visualization experience. The layout is structured yet engaging, making complex data accessible and visually appealing.
Key Features:
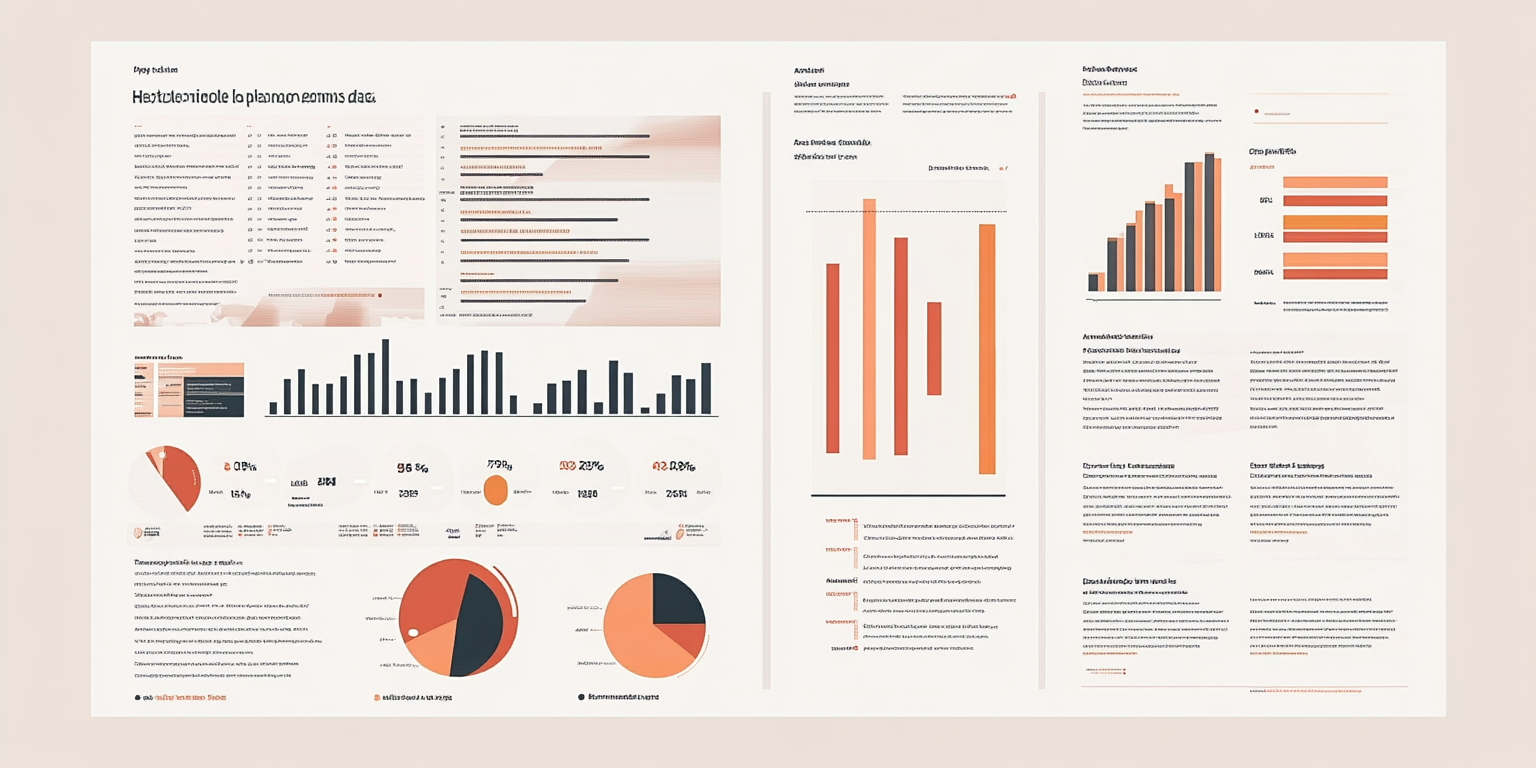
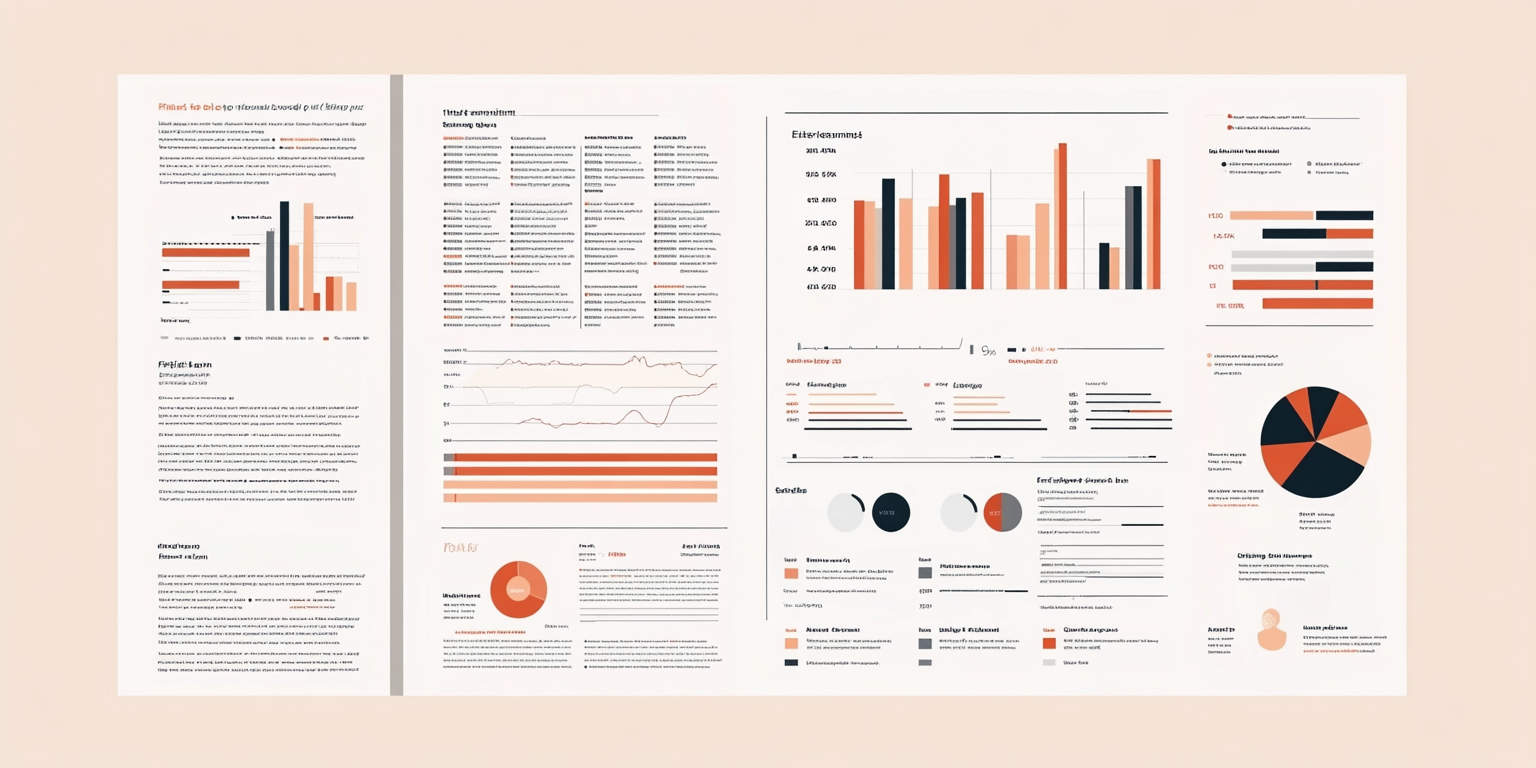
- Balanced Minimalist Aesthetic: Modern, airy spacing with sharp alignment for enhanced comprehension.
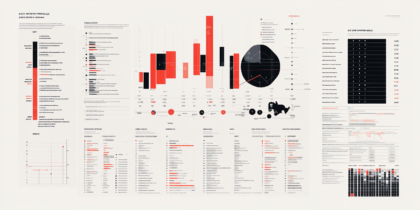
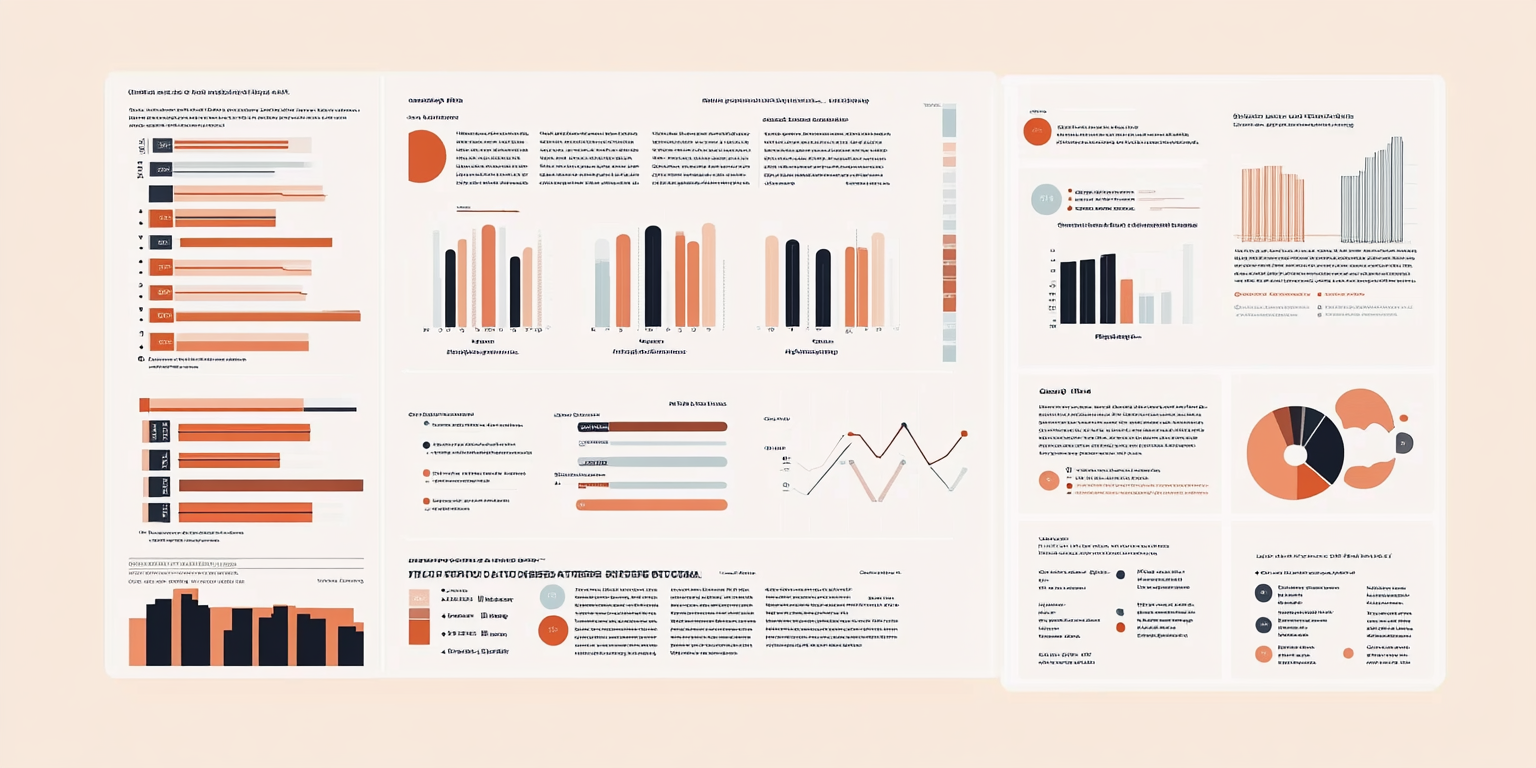
- Comprehensive Data Visualization: A mix of bar charts, pie charts, line graphs, and data heat maps for in-depth insights.
- Elegant & Professional Typography: A combination of serif and sans-serif fonts to ensure visual hierarchy and ease of reading.
- Versatile Usage: Ideal for financial reports, business intelligence dashboards, and research documentation.
- Refined Color Scheme: Muted coral, navy, and soft neutral tones contribute to an elegant yet authoritative design.
Deliverables
- Full business report templates
- Infographic slides for presentations
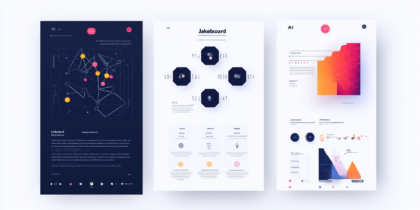
- Digital assets for corporate dashboards and social media reports
- High-quality printed materials for executive summaries
Tools Used
- Adobe Illustrator (Infographic Design & Layouts)
- Adobe InDesign (Report Formatting & Print Optimization)
- Figma (Digital Dashboard & UI Elements)
Impact & Market Appeal
- Data-Driven Decision Making: Enhances clarity in corporate reports, business strategies, and executive summaries.
- Timeless & Modern Appeal: Suitable for industries including finance, tech, consulting, and research firms.
- Optimized for Readability & Aesthetics: Ensures that insights are digestible without overwhelming the viewer.
Challenges & Solutions
Challenges Encountered
- Maintaining a balance between detailed data representation and minimalism without clutter.
- Ensuring visual hierarchy in a way that emphasizes key data points without losing analytical depth.
Solutions Implemented
- Designed strategic whitespace to prevent information overload while maintaining visual flow.
- Developed a clear typographic system to structure headlines, subheadings, and data points effectively.