Project Overview
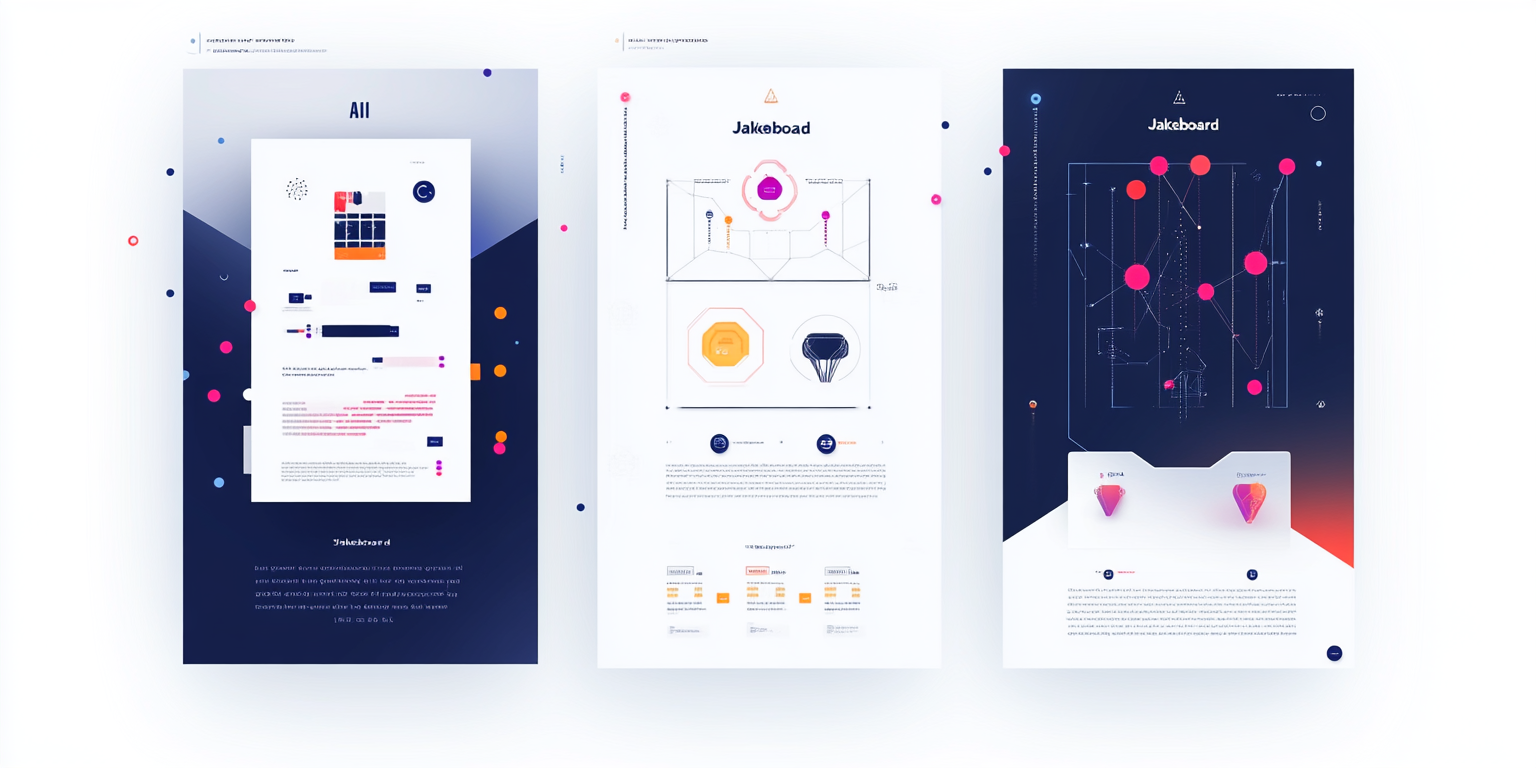
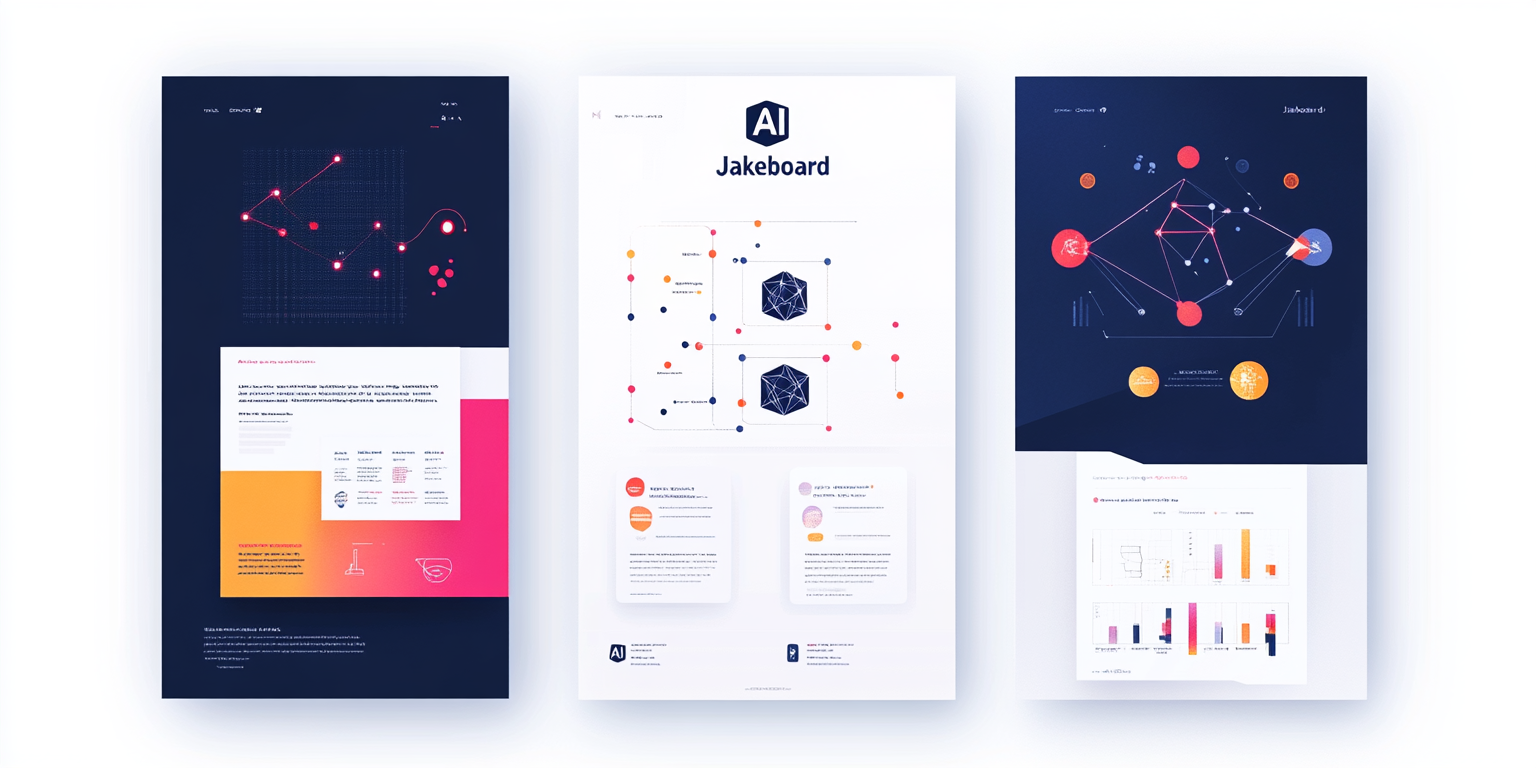
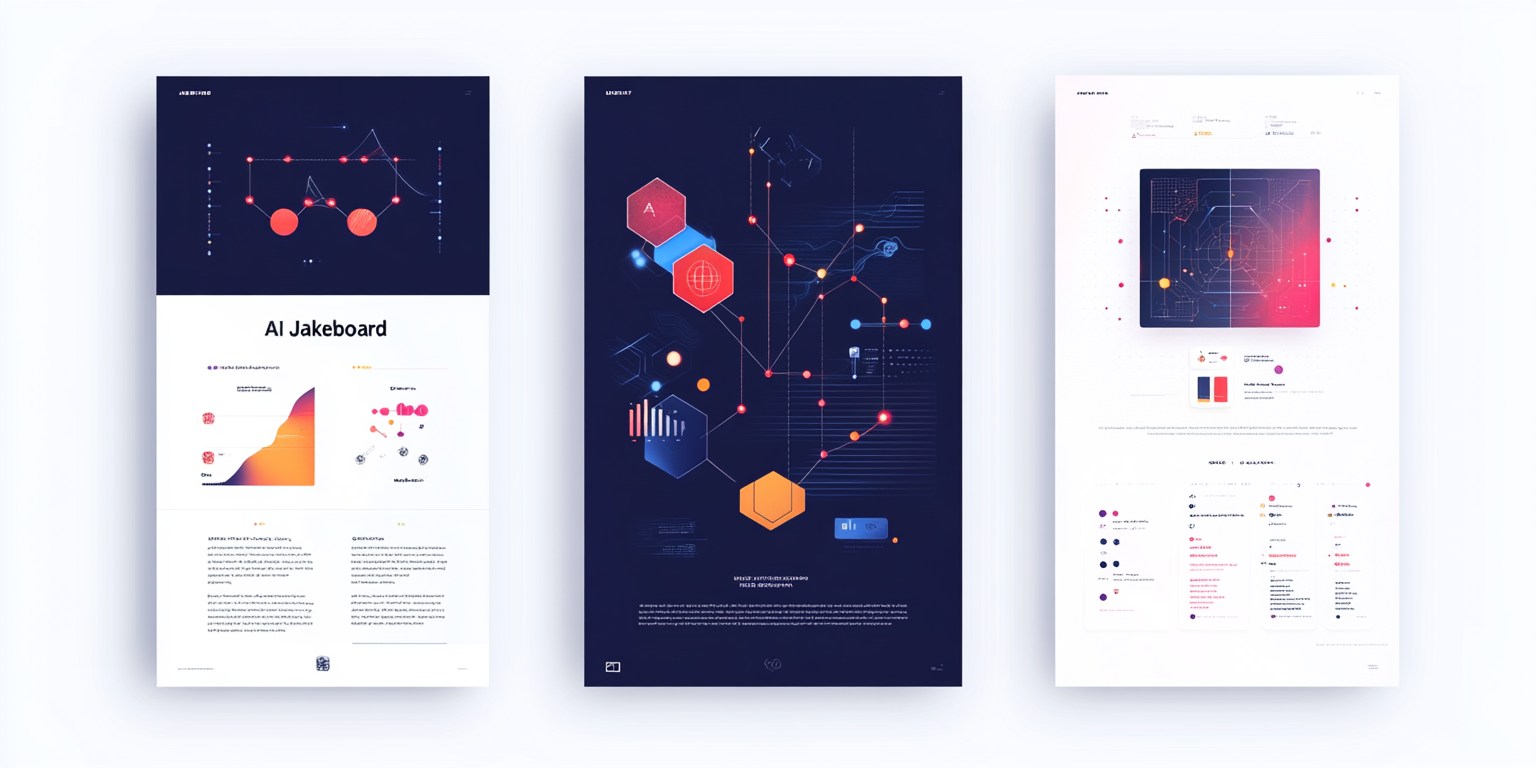
The Jakeboard AI Data Visualization Collection is a next-generation, AI-powered visual identity system that redefines how data is presented. This sleek, futuristic design blends dark mode aesthetics with vibrant neon-infused accents to create an immersive, tech-forward experience.
- Year of Completion: 2023
- Status: Active
Design Concept
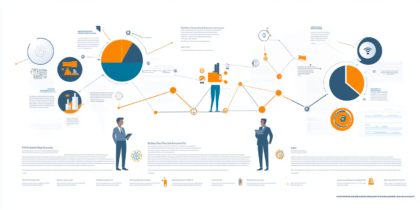
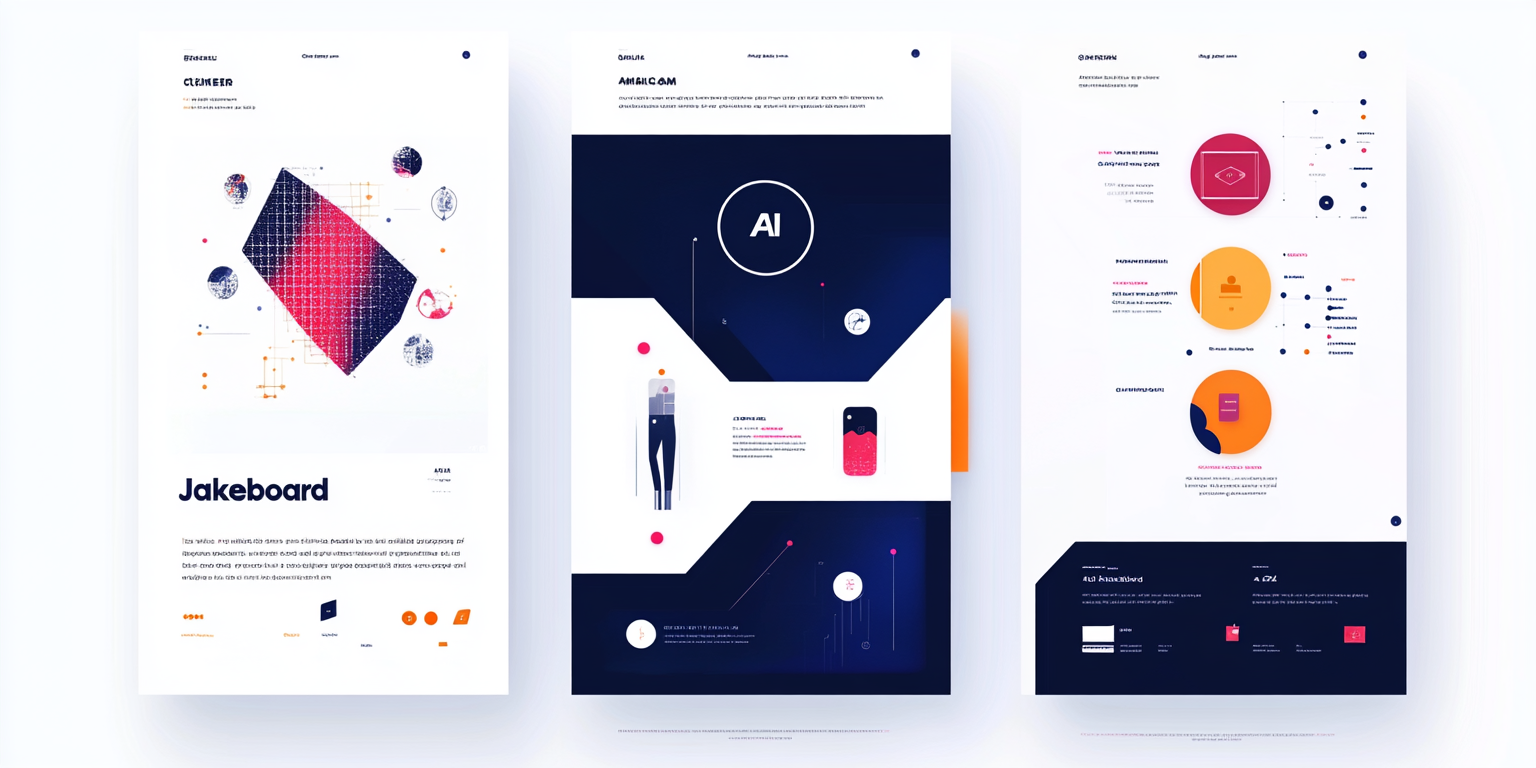
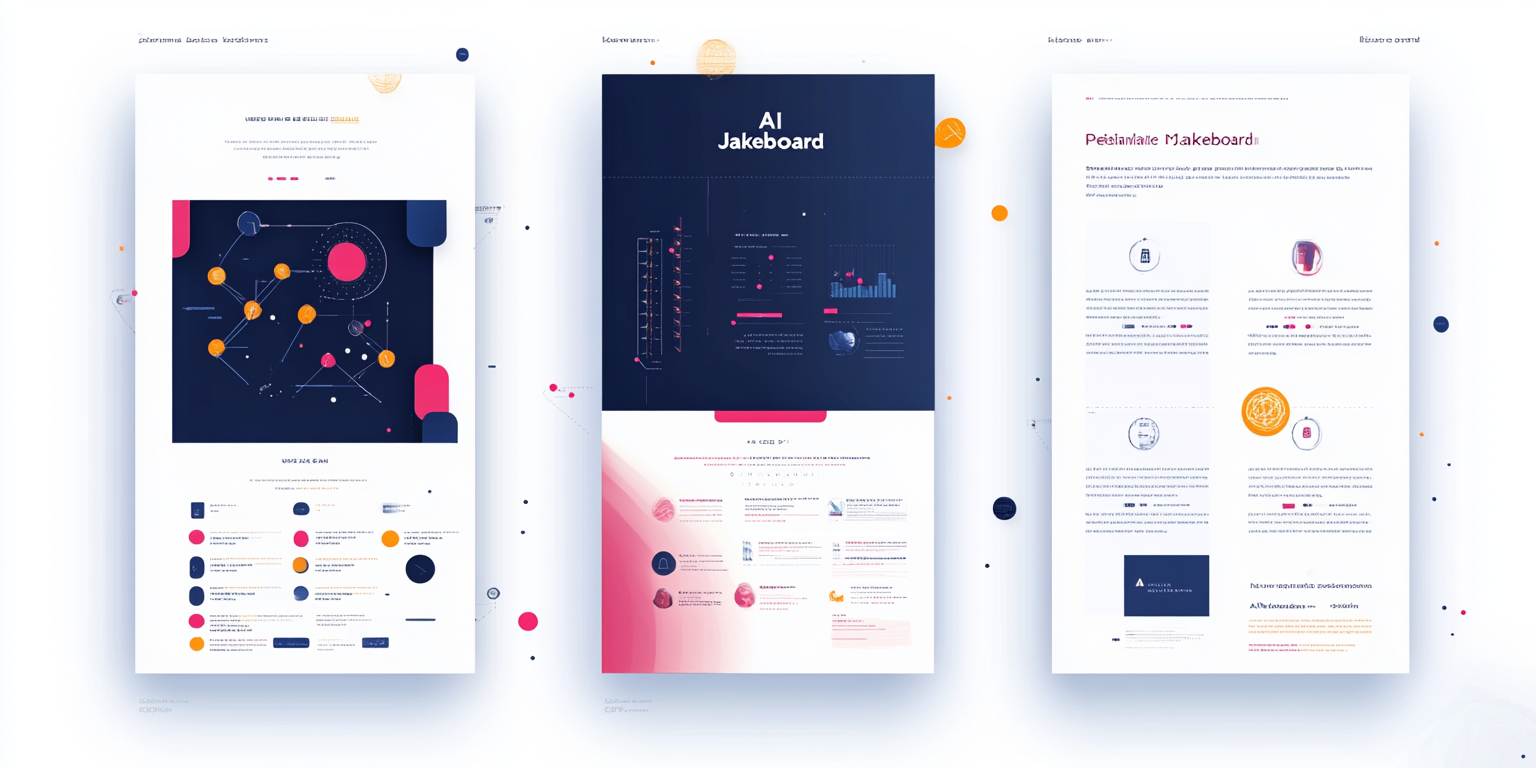
This branding system is tailored for AI-driven data platforms, technology firms, and businesses leveraging artificial intelligence for analytics. The concept revolves around dynamic interconnectivity, futuristic typography, and sleek data visualization layouts, making complex data easily digestible.
Key Features:
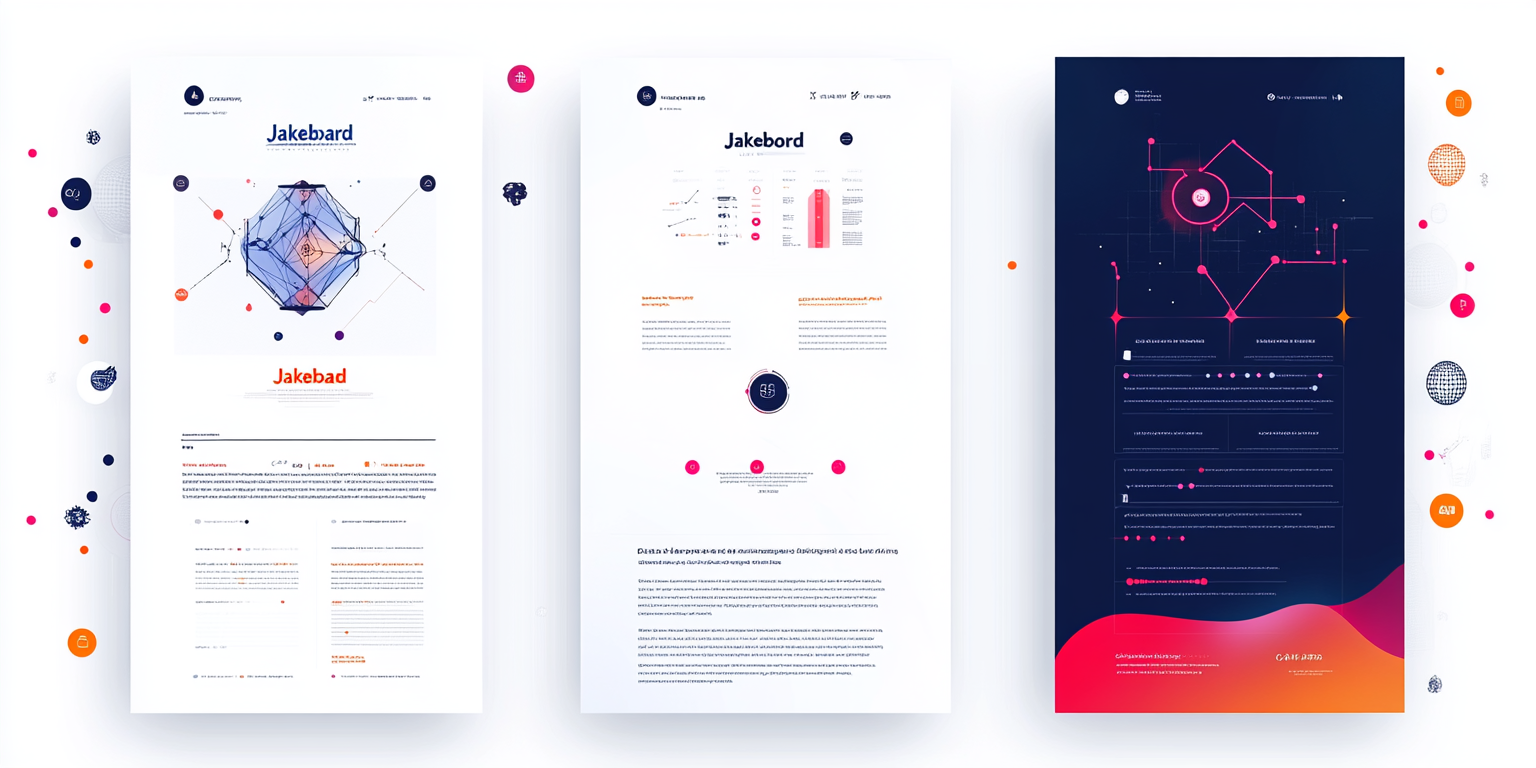
- Dark Mode Aesthetic: Deep navy backgrounds paired with glowing neon pink, orange, and blue highlights for a cutting-edge look.
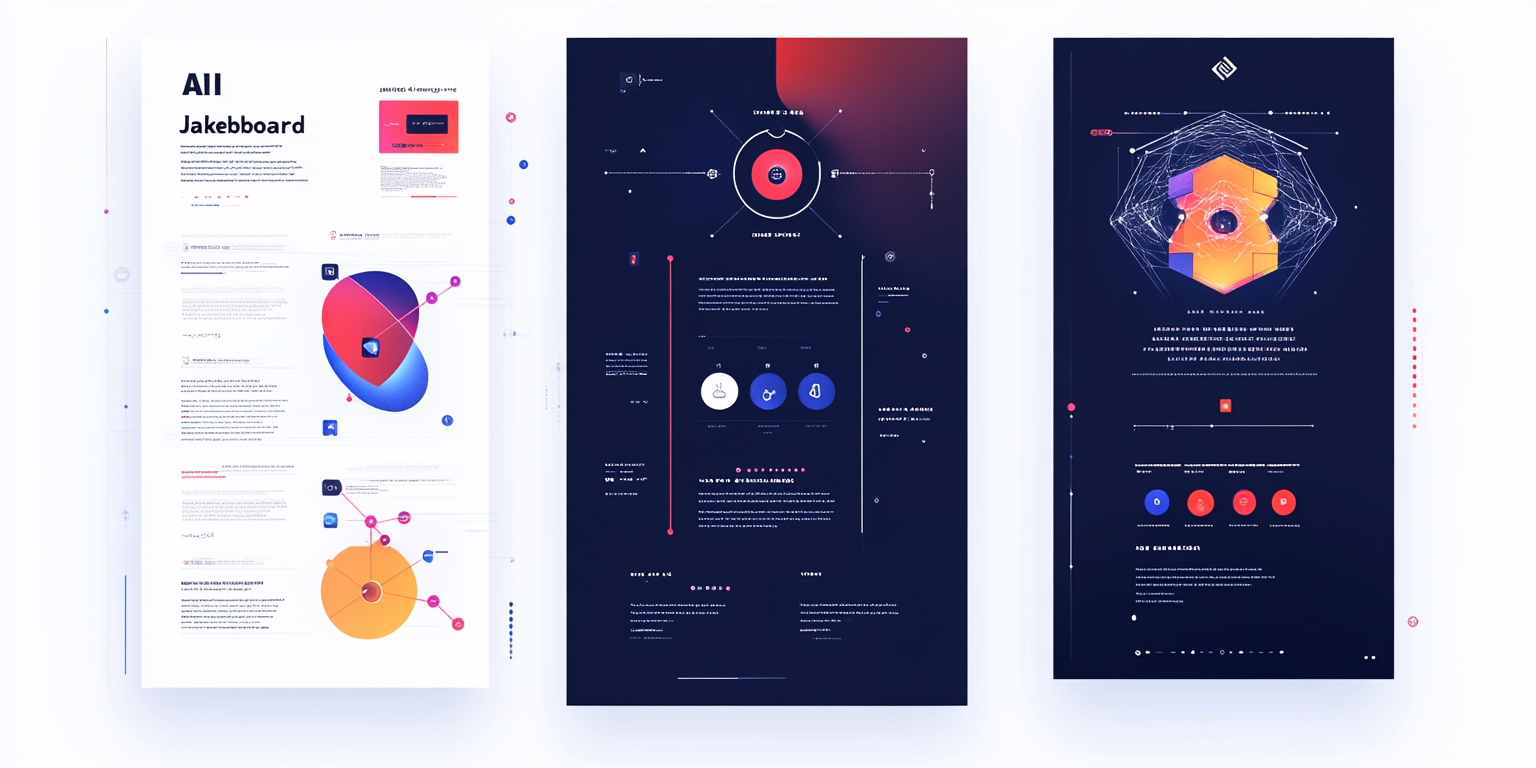
- AI-Enhanced Data Mapping: A network of interconnected data points creates a futuristic, algorithm-driven feel.
- Innovative Typography: Sleek, modern fonts enhance readability while complementing the advanced tech aesthetic.
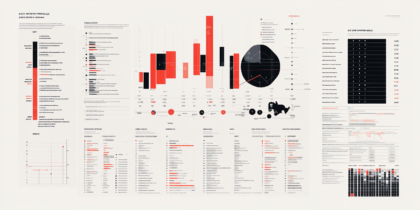
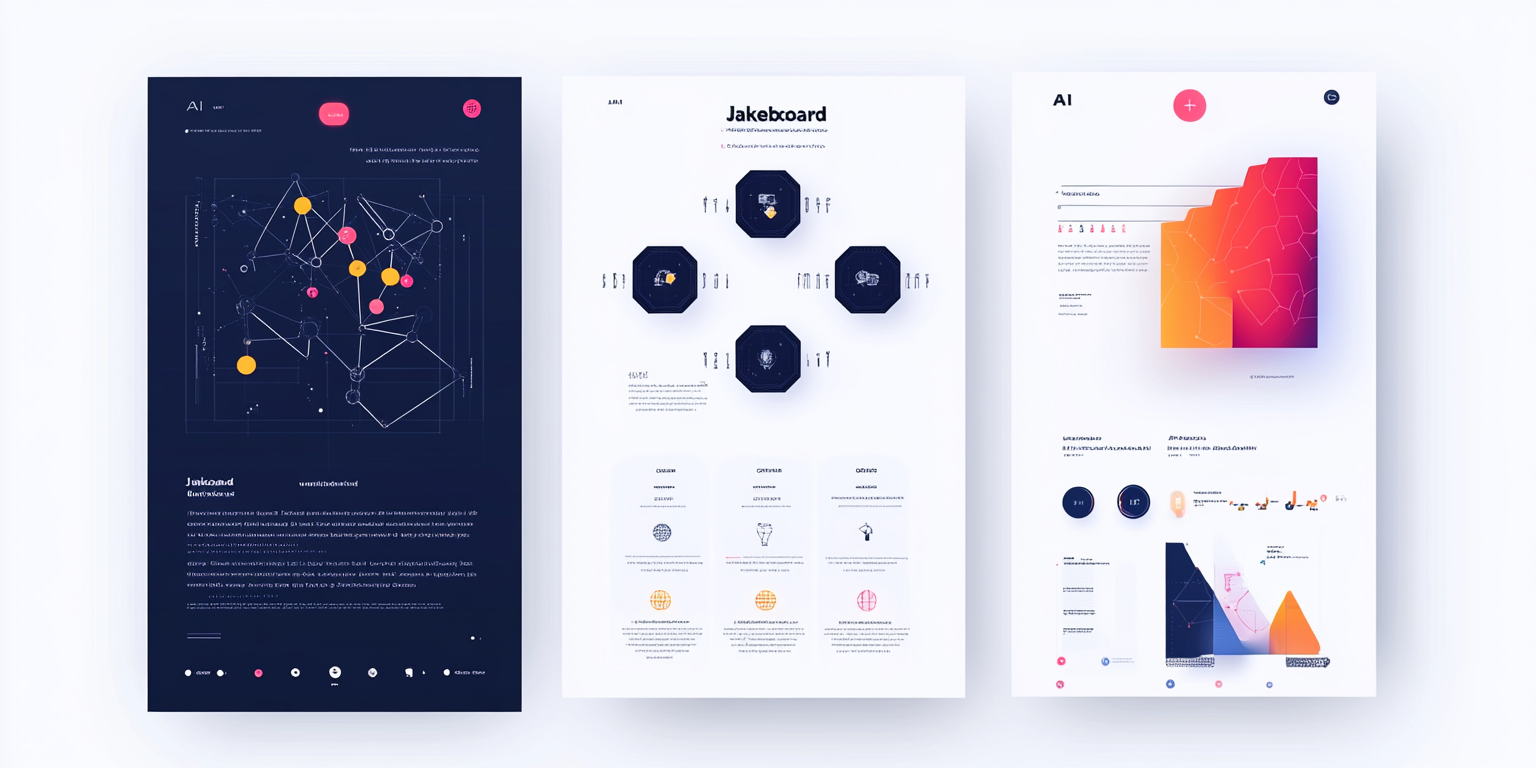
- High-Tech UI/UX Elements: Minimalist yet powerful dashboards, charts, and graphs for maximum impact.
- Versatile Application: Ideal for AI startups, fintech platforms, cybersecurity firms, and advanced research institutions.
Deliverables
- Complete brand identity package
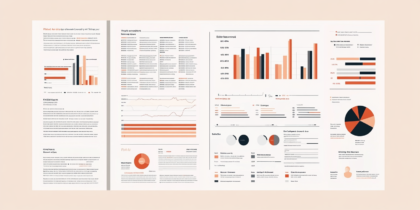
- AI-driven data visualization templates
- Business reports, dashboards, and marketing materials
- User interface and experience design for AI systems
- Social media and digital assets
Tools Used
- Adobe Illustrator (Vector Graphics & Branding Elements)
- Adobe Photoshop (Mockups & UI Elements)
- Figma (UX/UI Prototyping)
- Blender (3D Visual Concepts)
Impact & Market Appeal
- Next-Level Data Visualization: Designed to revolutionize how AI-driven platforms display analytics.
- Cutting-Edge Technology Appeal: Perfect for futuristic and high-tech businesses.
- Seamless User Experience: Intuitive data structures make information accessible and engaging.
Challenges & Solutions
Challenges Encountered
- Balancing sleek aesthetics with functional data readability.
- Creating a futuristic yet user-friendly design for diverse industries.
Solutions Implemented
- Developed an intuitive color-coded system for seamless data comprehension.
- Integrated AI-driven graph patterns for automated, intelligent data insights.