
Project Overview
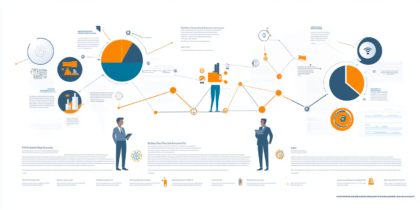
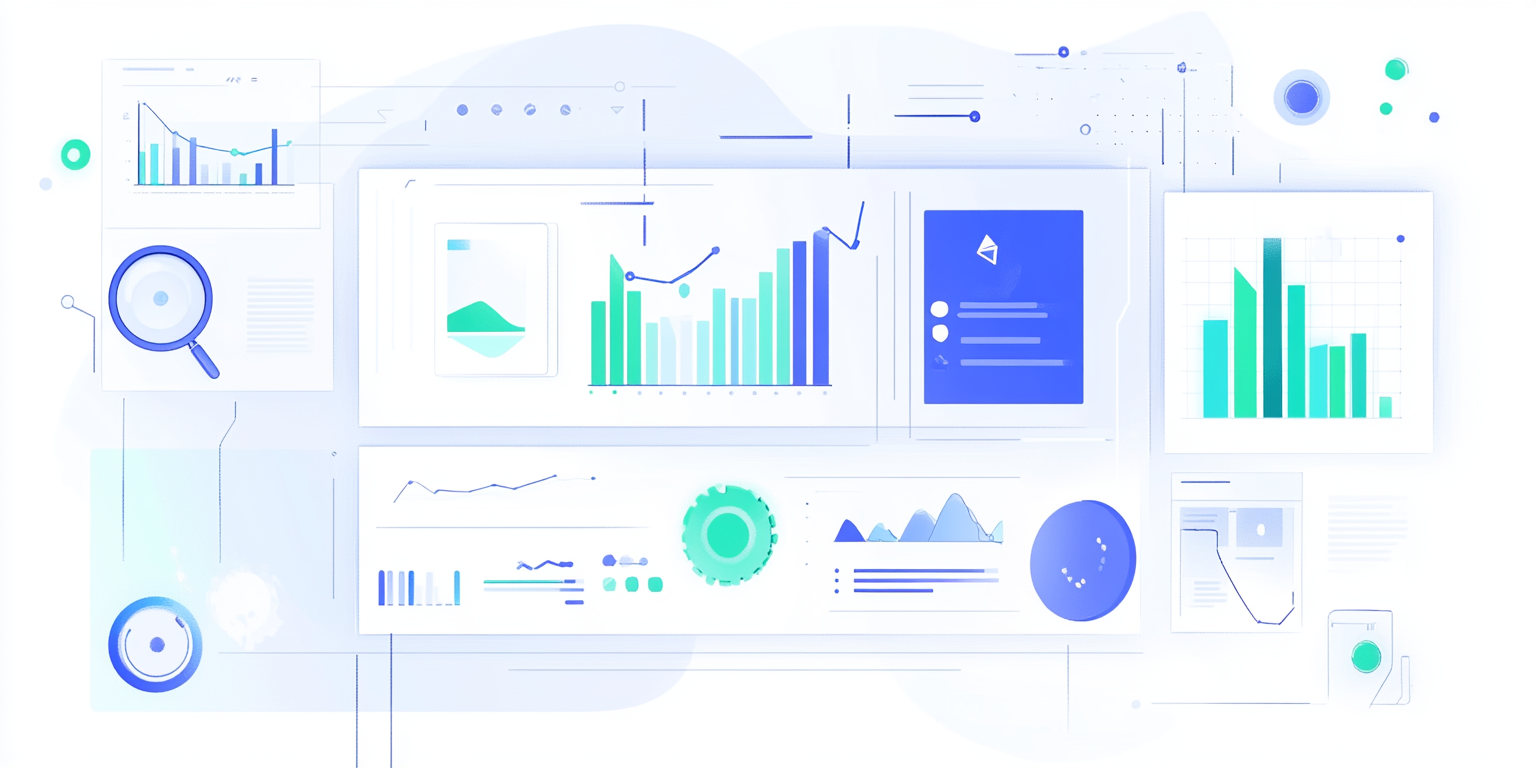
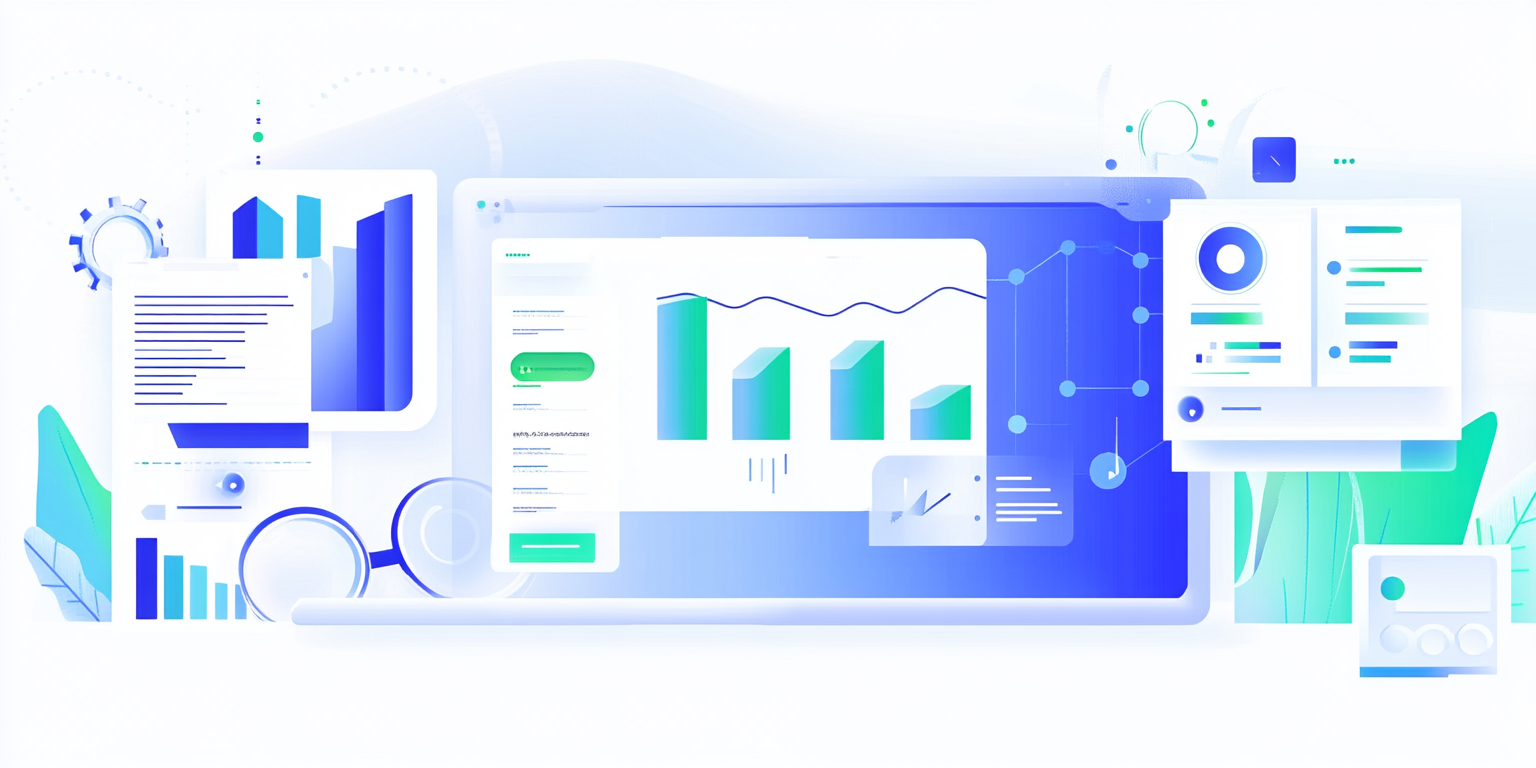
The AI-Driven Data Visualization Collection brings a futuristic and high-tech approach to presenting complex data. This collection seamlessly integrates artificial intelligence and big data analytics with sleek, modern aesthetics to deliver intuitive insights.
- Year of Completion: 2021
- Status: Active
Design Concept
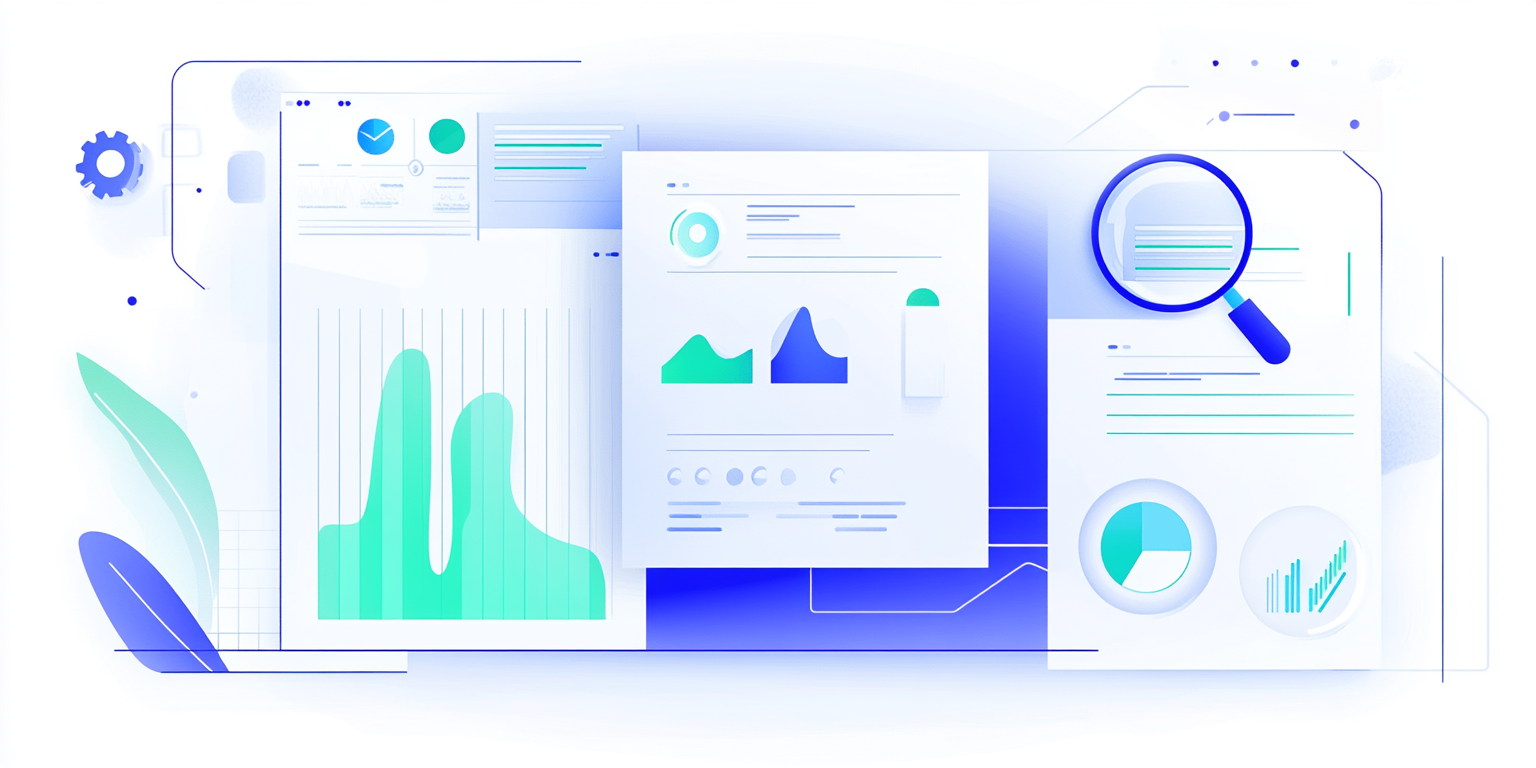
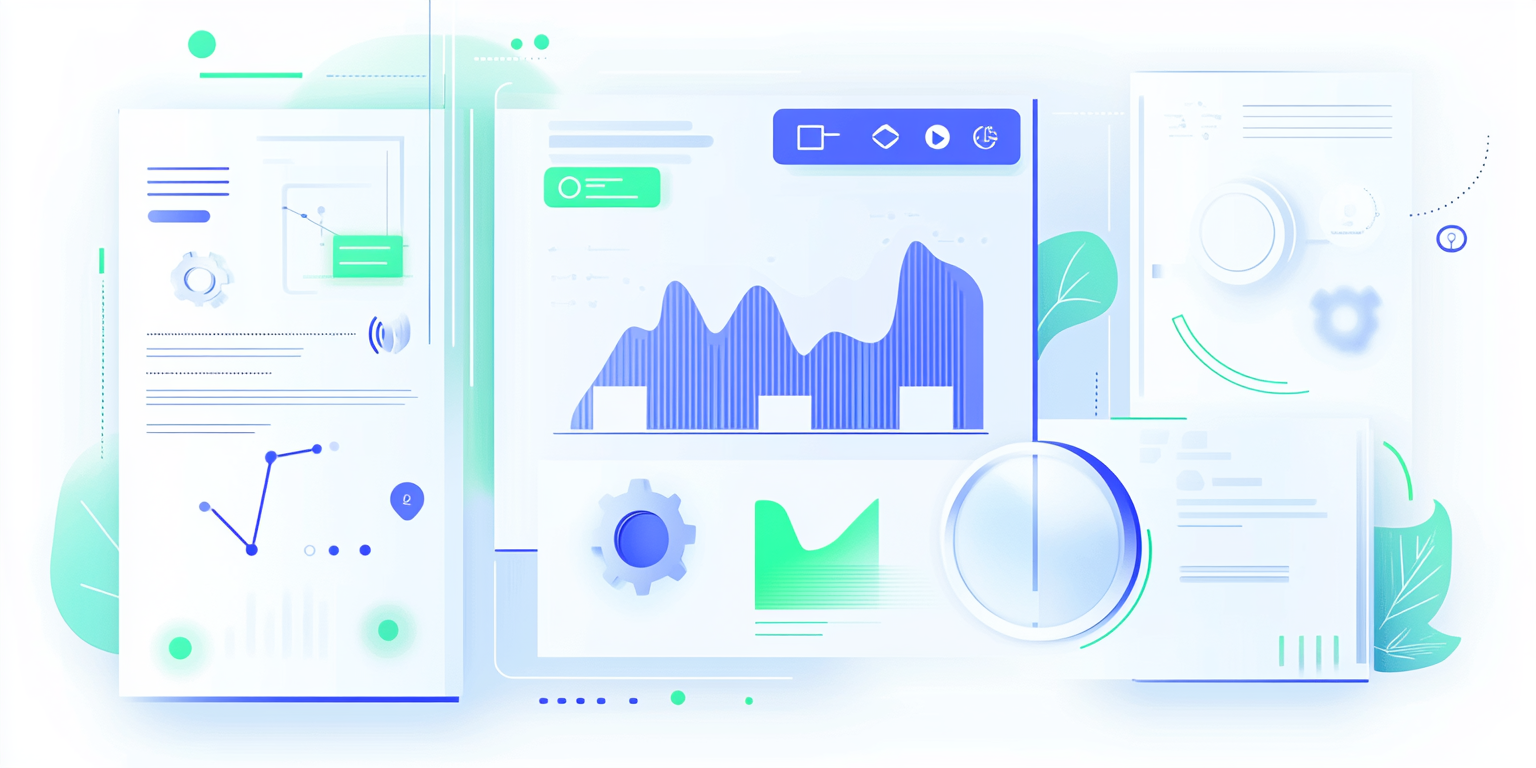
This visual identity embodies a high-tech, futuristic aesthetic through an advanced color palette and dynamic data representations. Designed for cutting-edge AI firms, fintech platforms, and enterprise analytics tools, it merges functionality with sleek, immersive visuals.
Key Features:
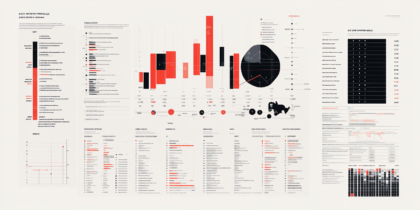
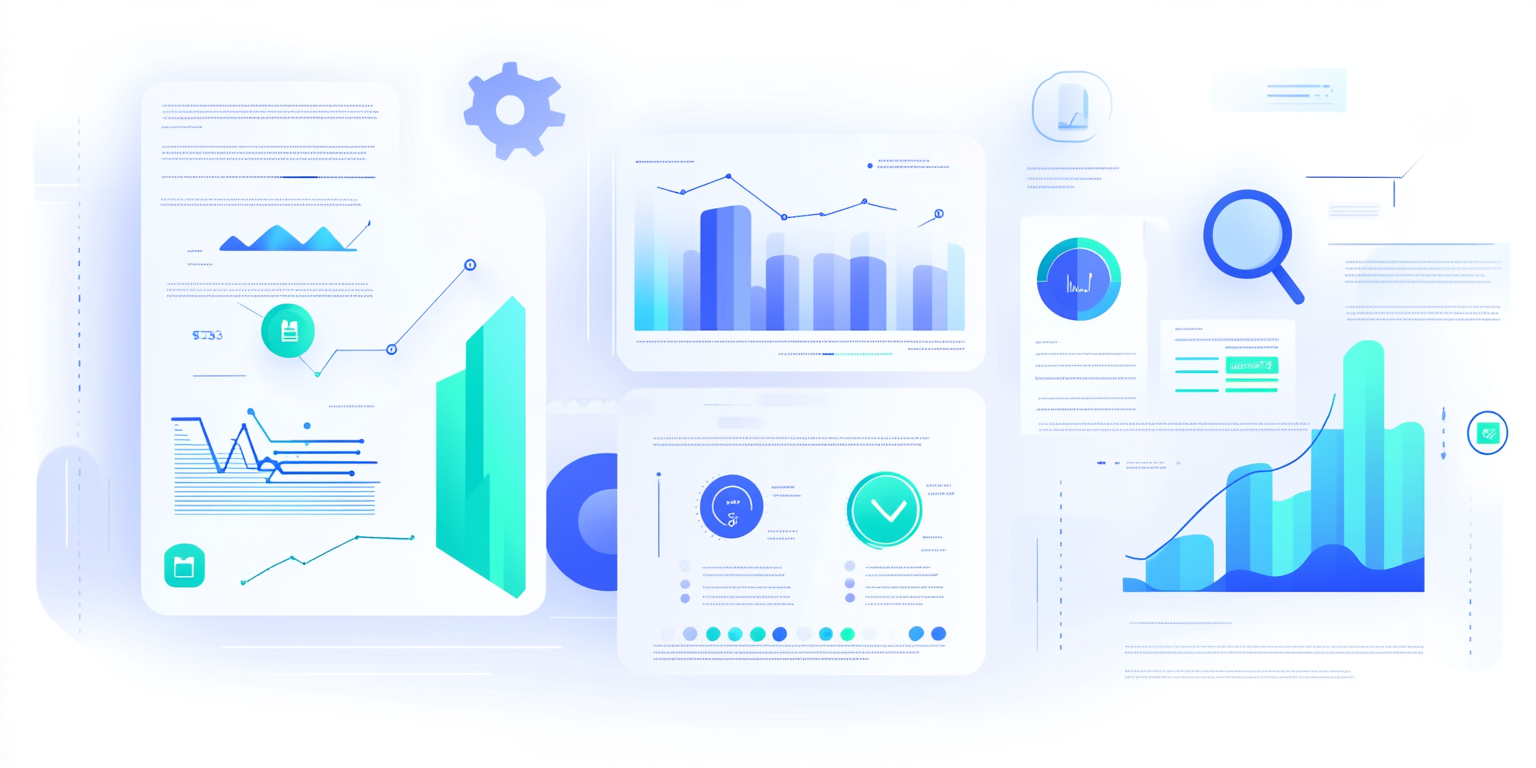
- AI-Enhanced Visuals: Smartly structured dashboards, network diagrams, and predictive analytics representations.
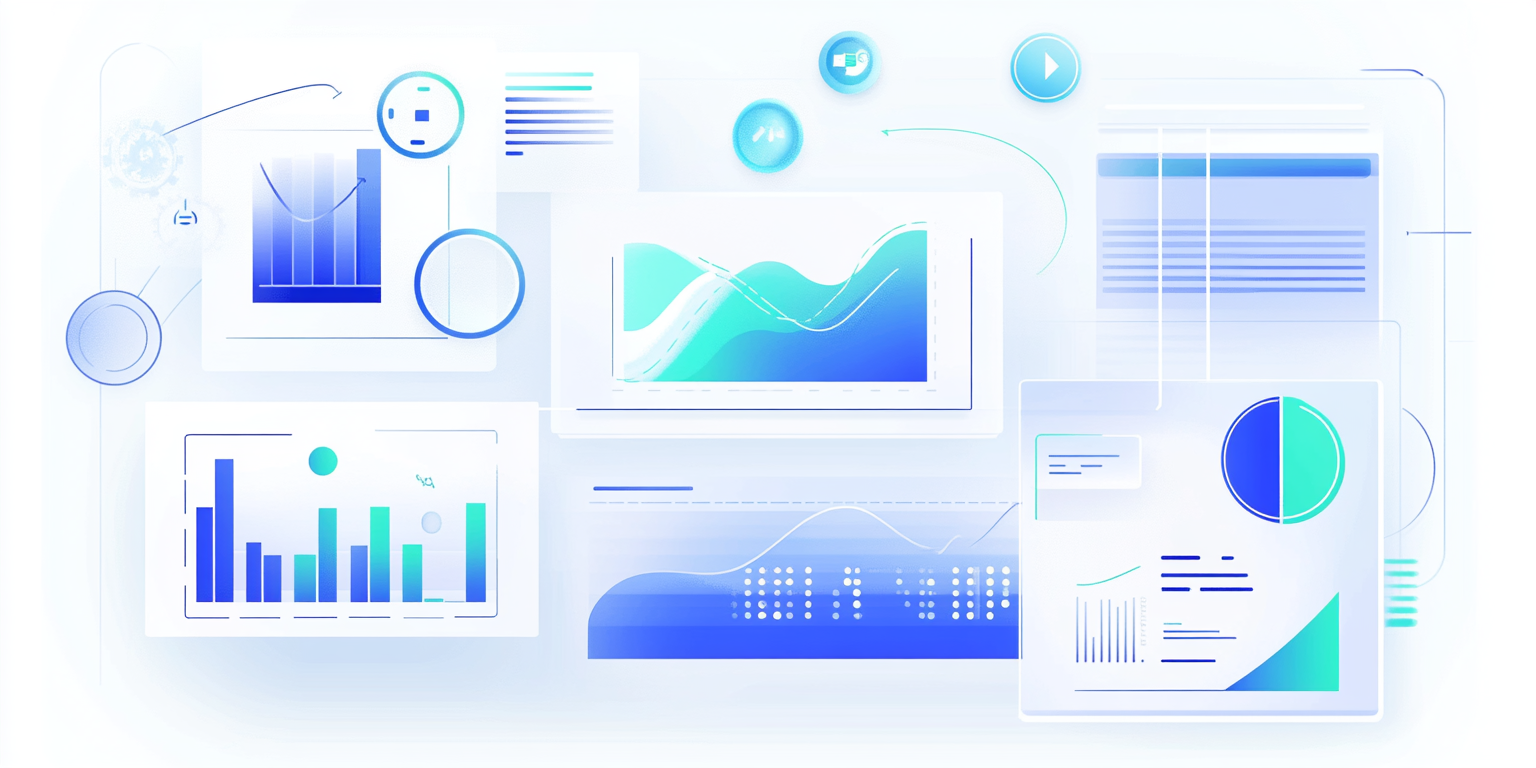
- Innovative Data Storytelling: Interactive graphs, abstract neural networks, and futuristic UI elements.
- Intelligent Aesthetic: A polished blend of deep blue, neon green, and gradient cyan tones.
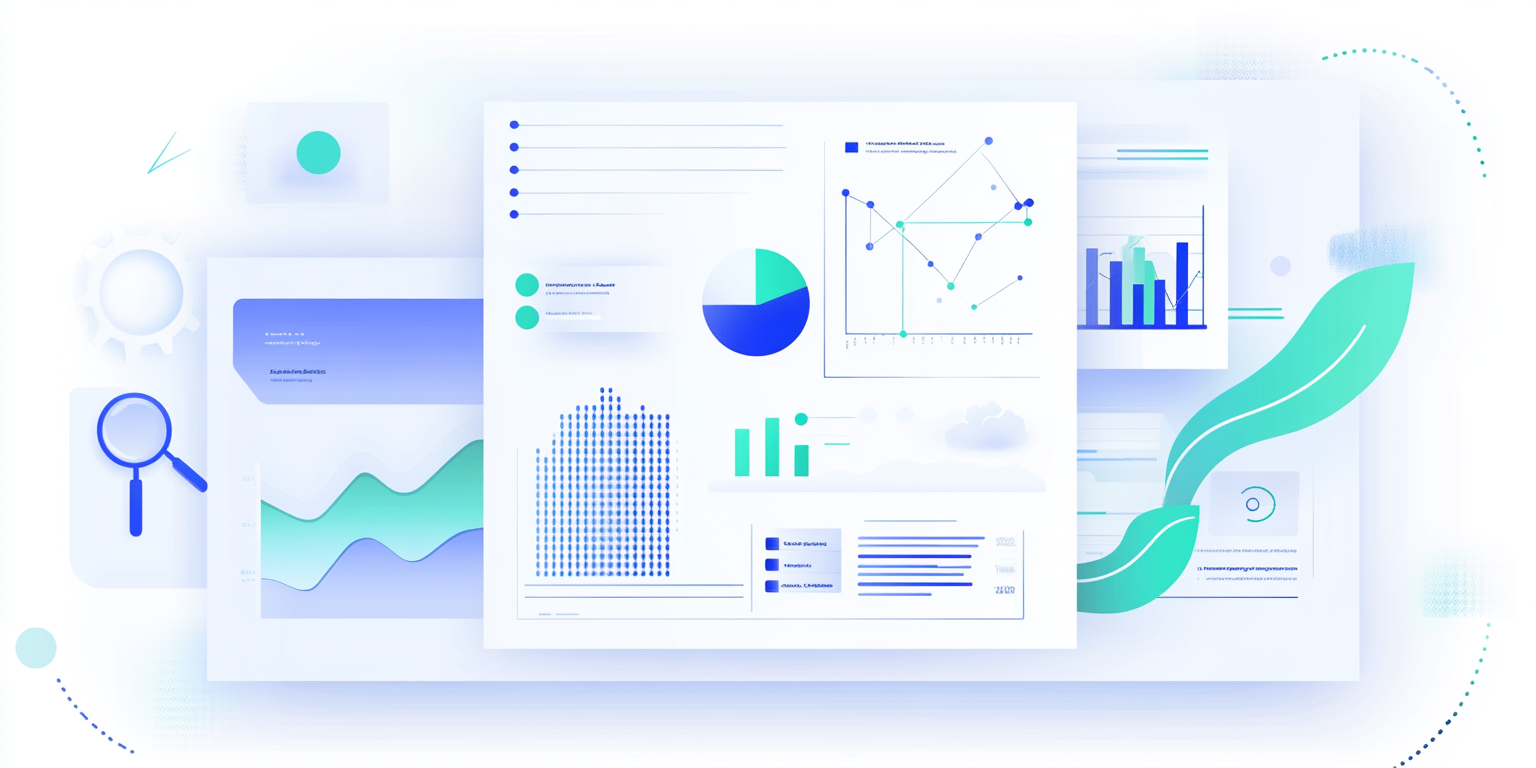
- Seamless User Experience: Designed for intuitive navigation, enhancing accessibility to complex information.
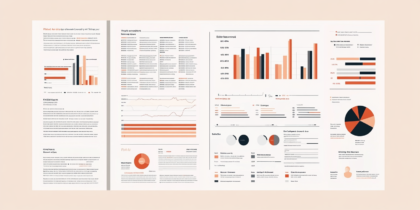
- Advanced Infographic Elements: Machine-learning-based insights presented in clear, engaging visuals.
Deliverables
- Full AI-powered data visualization system
- Business intelligence dashboards & UI components
- Animated infographics for digital platforms
- Futuristic corporate identity for AI & analytics firms
- Web and mobile app interfaces
Tools Used
- Figma & Adobe XD (UI/UX Design)
- Adobe Illustrator (Data Graphics & Visual Identity)
- Python & Tableau (Data Visualization & Predictive Modeling)
Impact & Market Appeal
- AI-First Digital Branding: Tailored for fintech, research institutions, and AI startups.
- Seamless Integration with Analytics Platforms: Supports dynamic data streams and real-time insights.
- Visually Engaging & Functional: A balance of futuristic aesthetics and high-end professional appeal.
Challenges & Solutions
Challenges Encountered
- Creating highly detailed data-driven visuals while maintaining a sleek, modern look.
- Ensuring scalability for multiple industries, from fintech to AI research.
Solutions Implemented
- Developed an adaptive interface that responds dynamically to real-time analytics.
- Implemented gradient-based color schemes to enhance clarity and engagement.